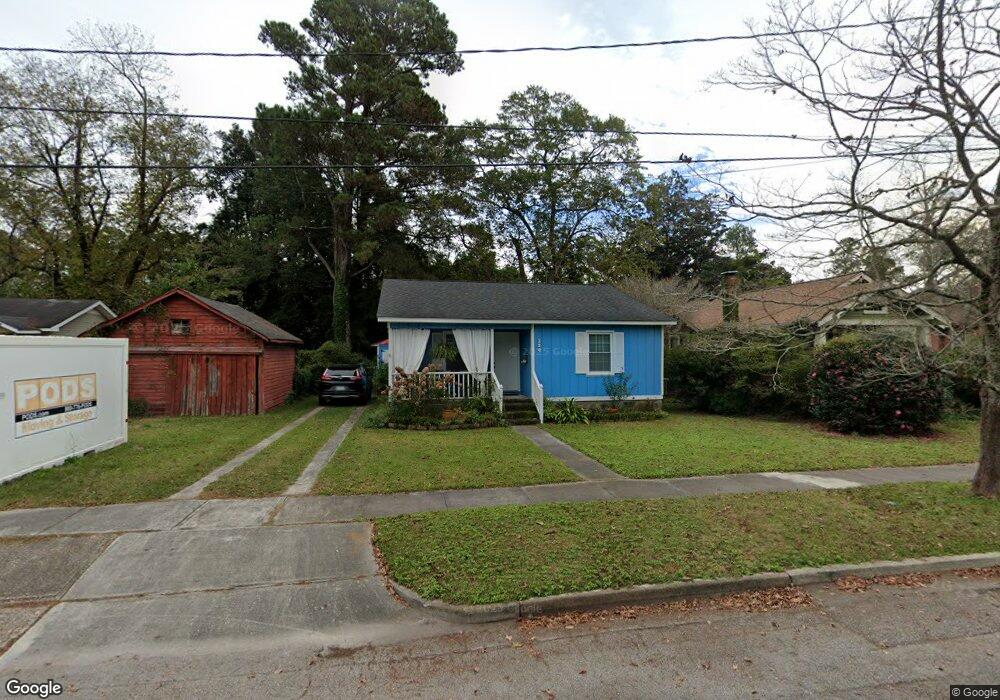
324 25th St N Wilmington, NC 28405
Carolina Heights NeighborhoodEstimated Value: $314,000 - $358,000
2
Beds
2
Baths
975
Sq Ft
$334/Sq Ft
Est. Value
About This Home
This home is located at 324 25th St N, Wilmington, NC 28405 and is currently estimated at $325,646, approximately $333 per square foot. 324 25th St N is a home located in New Hanover County with nearby schools including Rachel Freeman School of Engineering, Williston Middle School, and New Hanover High School.
Ownership History
Date
Name
Owned For
Owner Type
Purchase Details
Closed on
Sep 18, 2013
Sold by
Federal National Mortgage Association
Bought by
Fannon Robert and Fannon Mary
Current Estimated Value
Purchase Details
Closed on
Mar 25, 2013
Sold by
Martindale Jeanie L and Bank Of America Na
Bought by
Federal National Mortgage Association and Fannie Mae
Purchase Details
Closed on
Jan 23, 2004
Sold by
Wade Jeanie L
Bought by
Martindale Jeanie L
Purchase Details
Closed on
May 3, 1994
Sold by
Scott David W Kimberly P
Bought by
Wade Jeanie L
Purchase Details
Closed on
Apr 4, 1994
Sold by
Scott David W Kimberly P
Bought by
Wade Jeanie L
Purchase Details
Closed on
Jul 31, 1990
Sold by
Richardson Iii Van V
Bought by
Scott David W Kimberly P
Purchase Details
Closed on
Mar 1, 1984
Sold by
Plott C L Gail C
Bought by
Richardson Iii
Purchase Details
Closed on
Dec 1, 1983
Sold by
Worley Grace S
Bought by
Plott C L Gail C
Create a Home Valuation Report for This Property
The Home Valuation Report is an in-depth analysis detailing your home's value as well as a comparison with similar homes in the area
Home Values in the Area
Average Home Value in this Area
Purchase History
| Date | Buyer | Sale Price | Title Company |
|---|---|---|---|
| Fannon Robert | -- | None Available | |
| Federal National Mortgage Association | $70,400 | None Available | |
| Martindale Jeanie L | -- | -- | |
| Wade Jeanie L | -- | -- | |
| Wade Jeanie L | $56,000 | -- | |
| Scott David W Kimberly P | $46,000 | -- | |
| Richardson Iii | $27,500 | -- | |
| Plott C L Gail C | $20,000 | -- |
Source: Public Records
Tax History Compared to Growth
Tax History
| Year | Tax Paid | Tax Assessment Tax Assessment Total Assessment is a certain percentage of the fair market value that is determined by local assessors to be the total taxable value of land and additions on the property. | Land | Improvement |
|---|---|---|---|---|
| 2025 | $2,032 | $345,200 | $104,500 | $240,700 |
| 2023 | $1,804 | $207,300 | $57,300 | $150,000 |
| 2022 | $1,762 | $207,300 | $57,300 | $150,000 |
| 2021 | $1,774 | $207,300 | $57,300 | $150,000 |
| 2020 | $1,210 | $114,900 | $32,000 | $82,900 |
| 2019 | $1,210 | $114,900 | $32,000 | $82,900 |
| 2018 | $1,210 | $114,900 | $32,000 | $82,900 |
| 2017 | $1,210 | $114,900 | $32,000 | $82,900 |
| 2016 | $1,052 | $94,900 | $36,000 | $58,900 |
| 2015 | $1,005 | $94,900 | $36,000 | $58,900 |
| 2014 | $962 | $94,900 | $36,000 | $58,900 |
Source: Public Records
Map
Nearby Homes
- 2402 Belvedere Dr
- 102 N 25th St
- 6 Keaton Ave
- 2906 Market St Unit 202
- 2926 Princess Place Dr
- 2212 Brandon Rd
- 115 Forest Hills Dr
- 2208 Carlton Ave
- 403 Noble St
- 17 Montgomery Ave
- 2007 Perry Ave
- 6 Montgomery Ave
- 1908 Princess St
- 421 Evans St
- 222 Evans St
- 431 Evans St
- 431-A Evans
- 1101 Emory St
- 1801 Grace St
- 505 N 21st St
- 324 N 25th St
- 320 N 25th St
- 2504 Princess Place Dr
- 314 N 25th St
- 321 N 26th St
- 2512 Princess Place Dr
- 2512 Princess Place Dr Unit 1
- 2512 Princess Place Dr Unit 3
- 317 N 26th St
- 310 N 25th St
- 313 N 26th St
- 2426 Princess Place Dr
- 2520 Princess Place Dr
- 2520 Princess Place Dr Unit A B C
- 309 N 26th St
- 319 N 25th St
- 319 N 25th St
- 306 N 25th St
- 2422 Princess Place Dr
- 305 N 26th St