324 8th St Plainwell, MI 49080
Estimated Value: $179,660 - $264,000
3
Beds
2
Baths
1,500
Sq Ft
$140/Sq Ft
Est. Value
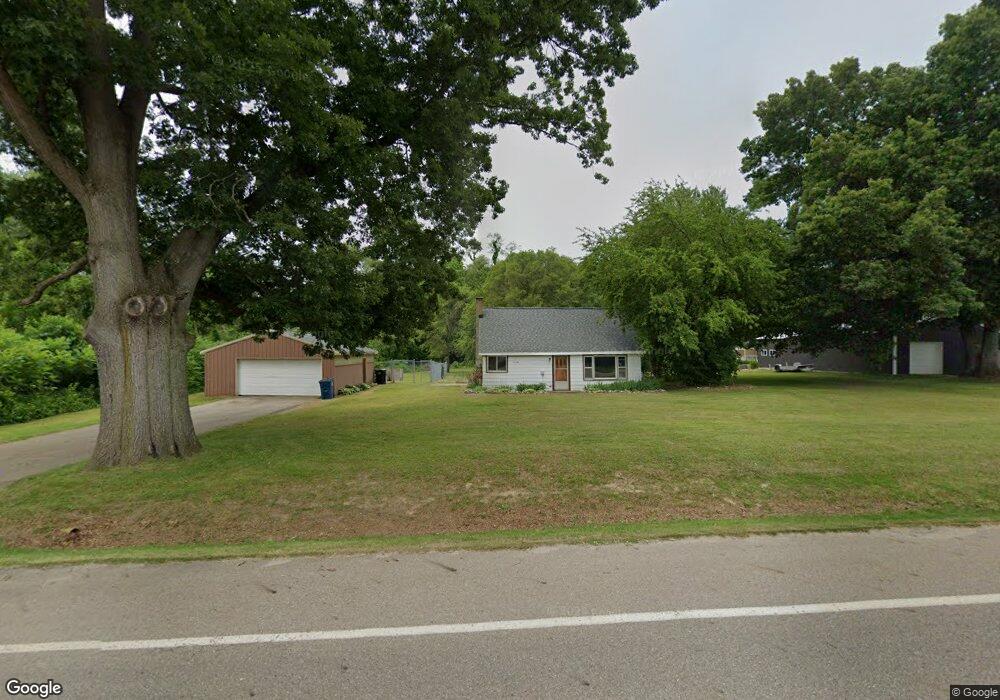
About This Home
This home is located at 324 8th St, Plainwell, MI 49080 and is currently estimated at $210,415, approximately $140 per square foot. 324 8th St is a home located in Allegan County with nearby schools including Plainwell High School and Otsego Christian Academy.
Ownership History
Date
Name
Owned For
Owner Type
Purchase Details
Closed on
Dec 6, 2010
Sold by
Fannie Mae
Bought by
Vandenberg Molly
Current Estimated Value
Purchase Details
Closed on
Feb 23, 2010
Sold by
Fifth Third Mortgage Company
Bought by
Federal National Mortgage Association
Purchase Details
Closed on
Feb 18, 2010
Sold by
Haight Jerry W and Haight Penny K
Bought by
Fifth Third Mortgage Company
Purchase Details
Closed on
Feb 25, 2009
Sold by
Haight Penny Kay
Bought by
Haight Jerry Wayne
Create a Home Valuation Report for This Property
The Home Valuation Report is an in-depth analysis detailing your home's value as well as a comparison with similar homes in the area
Home Values in the Area
Average Home Value in this Area
Purchase History
| Date | Buyer | Sale Price | Title Company |
|---|---|---|---|
| Vandenberg Molly | $52,900 | Attorneys Title Agency Llc | |
| Federal National Mortgage Association | -- | None Available | |
| Fifth Third Mortgage Company | $85,809 | None Available | |
| Haight Jerry Wayne | -- | None Available |
Source: Public Records
Tax History
| Year | Tax Paid | Tax Assessment Tax Assessment Total Assessment is a certain percentage of the fair market value that is determined by local assessors to be the total taxable value of land and additions on the property. | Land | Improvement |
|---|---|---|---|---|
| 2025 | $1,191 | $70,900 | $20,500 | $50,400 |
| 2024 | $1,089 | $65,100 | $15,500 | $49,600 |
| 2023 | $1,106 | $63,600 | $14,500 | $49,100 |
| 2022 | $1,089 | $56,500 | $13,900 | $42,600 |
| 2020 | $1,011 | $31,000 | $7,400 | $23,600 |
| 2019 | $879 | $30,400 | $7,400 | $23,000 |
| 2018 | $879 | $26,800 | $7,400 | $19,400 |
| 2017 | $0 | $27,000 | $7,400 | $19,600 |
| 2016 | $0 | $26,700 | $7,400 | $19,300 |
| 2015 | -- | $26,700 | $7,400 | $19,300 |
| 2014 | -- | $28,500 | $7,400 | $21,100 |
| 2013 | -- | $27,700 | $7,400 | $20,300 |
Source: Public Records
Map
Nearby Homes
- 721 E Bridge St
- 143 Floral Ave
- 916 James St
- 830 Miller Rd Unit 26.98 Acres
- 936 James St
- 605 S Anderson St
- 140 W 1st Ave
- 575 Rushing Dr
- 1016 Wedgewood Dr
- V/L Bronson Ave
- 551 W Bridge St
- 531 Foxmoor Dr
- 320 S Sunset St
- 605 Marsh Rd
- 355 12th St
- 1038 Allen Ct
- 1224 102nd Ave
- 1248 Keith St
- 361 4th St
- 4537 W Ab Ave
Your Personal Tour Guide
Ask me questions while you tour the home.