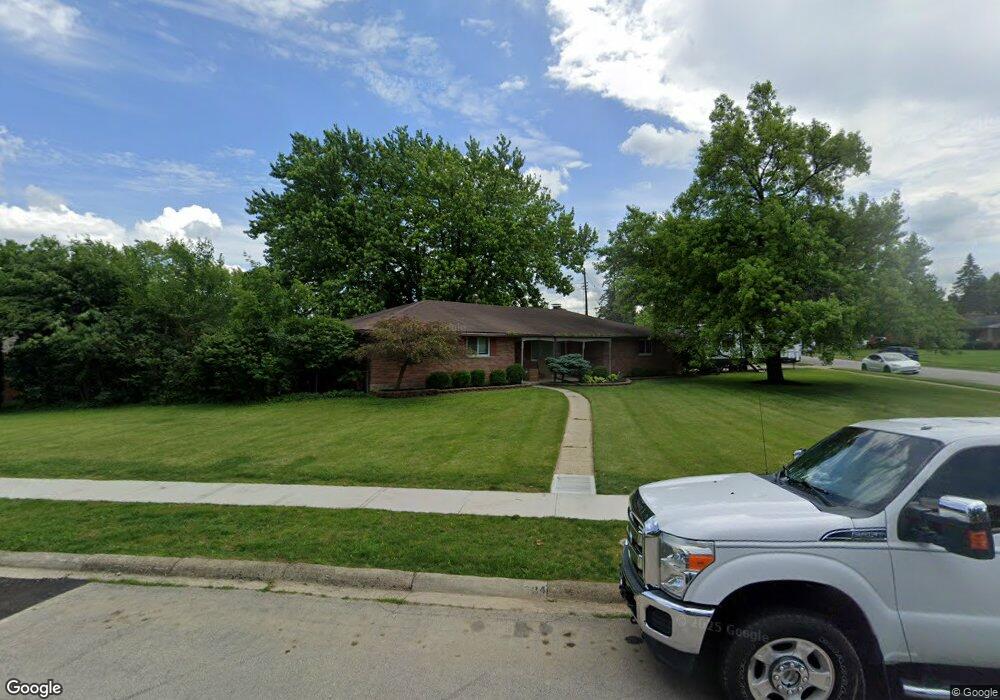
324 Camborne Dr Englewood, OH 45322
Estimated Value: $184,000 - $265,418
3
Beds
2
Baths
1,935
Sq Ft
$123/Sq Ft
Est. Value
About This Home
This home is located at 324 Camborne Dr, Englewood, OH 45322 and is currently estimated at $238,855, approximately $123 per square foot. 324 Camborne Dr is a home located in Montgomery County with nearby schools including Northmont High School and Salem Christian Academy.
Ownership History
Date
Name
Owned For
Owner Type
Purchase Details
Closed on
Oct 14, 2016
Sold by
Federal Home Loan Mortgage
Bought by
Staten John and Staten Tashawna
Current Estimated Value
Home Financials for this Owner
Home Financials are based on the most recent Mortgage that was taken out on this home.
Original Mortgage
$97,206
Outstanding Balance
$77,954
Interest Rate
3.47%
Estimated Equity
$160,901
Purchase Details
Closed on
Oct 13, 2016
Sold by
Federal Home Loan Mortgage Corpation
Bought by
John B Staten
Home Financials for this Owner
Home Financials are based on the most recent Mortgage that was taken out on this home.
Original Mortgage
$97,206
Outstanding Balance
$77,954
Interest Rate
3.47%
Estimated Equity
$160,901
Purchase Details
Closed on
Dec 10, 2015
Sold by
Miracle Donald J and Miracle Tiffany L
Bought by
Federal Home Loan Mortgage Corporation
Purchase Details
Closed on
Jun 24, 2005
Sold by
Kuruvilla Mary and Kuruvilla Jacob
Bought by
Miracle Donald J and Miracle Tiffany L
Home Financials for this Owner
Home Financials are based on the most recent Mortgage that was taken out on this home.
Original Mortgage
$125,250
Interest Rate
5.86%
Mortgage Type
Fannie Mae Freddie Mac
Create a Home Valuation Report for This Property
The Home Valuation Report is an in-depth analysis detailing your home's value as well as a comparison with similar homes in the area
Home Values in the Area
Average Home Value in this Area
Purchase History
| Date | Buyer | Sale Price | Title Company |
|---|---|---|---|
| Staten John | -- | -- | |
| John B Staten | -- | -- | |
| Federal Home Loan Mortgage Corporation | -- | None Available | |
| Miracle Donald J | $137,000 | -- |
Source: Public Records
Mortgage History
| Date | Status | Borrower | Loan Amount |
|---|---|---|---|
| Open | John B Staten | $97,206 | |
| Closed | John B Staten | -- | |
| Closed | John B Staten | -- | |
| Previous Owner | Miracle Donald J | $125,250 |
Source: Public Records
Tax History Compared to Growth
Tax History
| Year | Tax Paid | Tax Assessment Tax Assessment Total Assessment is a certain percentage of the fair market value that is determined by local assessors to be the total taxable value of land and additions on the property. | Land | Improvement |
|---|---|---|---|---|
| 2024 | $4,162 | $71,360 | $13,460 | $57,900 |
| 2023 | $4,162 | $71,360 | $13,460 | $57,900 |
| 2022 | $3,801 | $50,180 | $9,480 | $40,700 |
| 2021 | $3,813 | $50,180 | $9,480 | $40,700 |
| 2020 | $3,746 | $50,180 | $9,480 | $40,700 |
| 2019 | $3,413 | $40,990 | $10,900 | $30,090 |
| 2018 | $3,353 | $40,990 | $10,900 | $30,090 |
| 2017 | $3,332 | $40,990 | $10,900 | $30,090 |
| 2016 | $3,155 | $39,090 | $9,480 | $29,610 |
| 2015 | $3,141 | $39,090 | $9,480 | $29,610 |
| 2014 | $3,141 | $39,090 | $9,480 | $29,610 |
| 2012 | -- | $42,250 | $10,670 | $31,580 |
Source: Public Records
Map
Nearby Homes
- 320 Camborne Dr
- 408 W Herr St
- 332 Beckenham Rd
- 118 Elm Ct
- 322 Rankin Dr
- 321 Rankin Dr
- 123 Chestnut St
- 604 Heather St
- 208 S Walnut St
- 430 N Main St
- 108 Tate Ave
- 607 Albert St
- 109 Silverstone Dr
- 63 Sweet Potato Ridge Rd
- 104 Silverstone Dr
- 206 Lodestone Dr
- 520 S Main St
- 803 Albert St
- 306 Pauly Dr
- 108 Denwood Trail
- 322 Camborne Dr
- 202 Rumson St
- 325 W Herr St
- 325 Camborne Dr
- 203 Rumson St
- 205 Rumson St
- 323 Camborne Dr
- 201 Rumson St
- 323 W Herr St
- 207 Rumson St
- 321 Camborne Dr
- 321 W Herr St
- 326 W Herr St
- 210 Rumson St
- 204 Beechgrove Dr
- 324 W Herr St
- 206 Beechgrove Dr
- 318 Camborne Dr
- 322 Grantham Dr
- 202 Beechgrove Dr