J
Seller's Agent in 2024
Jay Li
Time Real Estate
(617) 888-1222
11 Total Sales
Estimated Value: $339,961 - $428,000
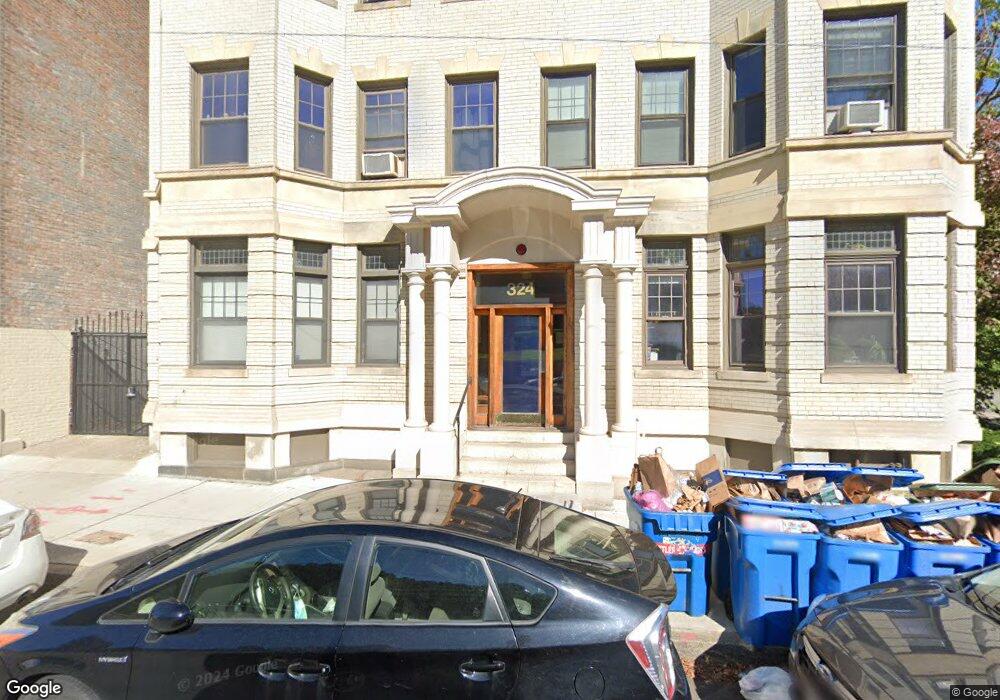
location, location, location. Move in today to this convenience vacant unit. Close to B,C,D Green lines. Boston College Shuttle Bus close by. Reservir and bike path across stree. High ceiling, big windows, heat and hot water are included. Laundry in the complex.
| Date | Buyer | Sale Price | Title Company |
|---|---|---|---|
| Huang Jay | $215,000 | -- | |
| Huang Jay | $215,000 | -- |
| Date | Status | Borrower | Loan Amount |
|---|---|---|---|
| Open | Huang Jay | $140,000 | |
| Closed | Huang Jay | $140,000 |
| Date | Event | Price | List to Sale | Price per Sq Ft |
|---|---|---|---|---|
| 04/29/2024 04/29/24 | Rented | $2,000 | 0.0% | -- |
| 04/23/2024 04/23/24 | For Rent | $2,000 | +29.0% | -- |
| 07/22/2020 07/22/20 | Under Contract | -- | -- | -- |
| 07/20/2020 07/20/20 | For Rent | $1,550 | -6.1% | -- |
| 08/10/2017 08/10/17 | Rented | $1,650 | 0.0% | -- |
| 08/07/2017 08/07/17 | Under Contract | -- | -- | -- |
| 08/01/2017 08/01/17 | For Rent | $1,650 | +3.1% | -- |
| 08/31/2016 08/31/16 | Rented | $1,600 | 0.0% | -- |
| 08/30/2016 08/30/16 | Under Contract | -- | -- | -- |
| 08/24/2016 08/24/16 | Price Changed | $1,600 | -5.9% | $3 / Sq Ft |
| 08/05/2016 08/05/16 | For Rent | $1,700 | +9.7% | -- |
| 07/15/2014 07/15/14 | Rented | $1,550 | -3.1% | -- |
| 07/15/2014 07/15/14 | For Rent | $1,600 | -- | -- |
| Year | Tax Paid | Tax Assessment Tax Assessment Total Assessment is a certain percentage of the fair market value that is determined by local assessors to be the total taxable value of land and additions on the property. | Land | Improvement |
|---|---|---|---|---|
| 2025 | $3,677 | $317,500 | $0 | $317,500 |
| 2024 | $3,791 | $347,800 | $0 | $347,800 |
| 2023 | $3,735 | $347,800 | $0 | $347,800 |
| 2022 | $3,570 | $328,100 | $0 | $328,100 |
| 2021 | $3,501 | $328,100 | $0 | $328,100 |
| 2020 | $2,827 | $267,700 | $0 | $267,700 |
| 2019 | $2,767 | $262,500 | $0 | $262,500 |
| 2018 | $2,572 | $245,400 | $0 | $245,400 |
| 2017 | $2,407 | $227,300 | $0 | $227,300 |
| 2016 | $2,140 | $194,500 | $0 | $194,500 |
| 2015 | $1,953 | $161,300 | $0 | $161,300 |
| 2014 | $1,843 | $146,500 | $0 | $146,500 |
J
Seller's Agent in 2024
Jay Li
Time Real Estate
(617) 888-1222
11 Total Sales

Buyer's Agent in 2024
Lisa Godwin
Gibson Sothebys International Realty
(617) 686-0405
47 Total Sales
A
Buyer's Agent in 2017
Ainslie Wallin
Amo Realty - Boston City Properties
N
Seller's Agent in 2014
Nick Spagnola
Centre Realty Group
Buyer's Agent in 2014
Christopher Parnell
Douglas Elliman Real Estate - The Sarkis Team
(617) 792-4554
1 Total Sale