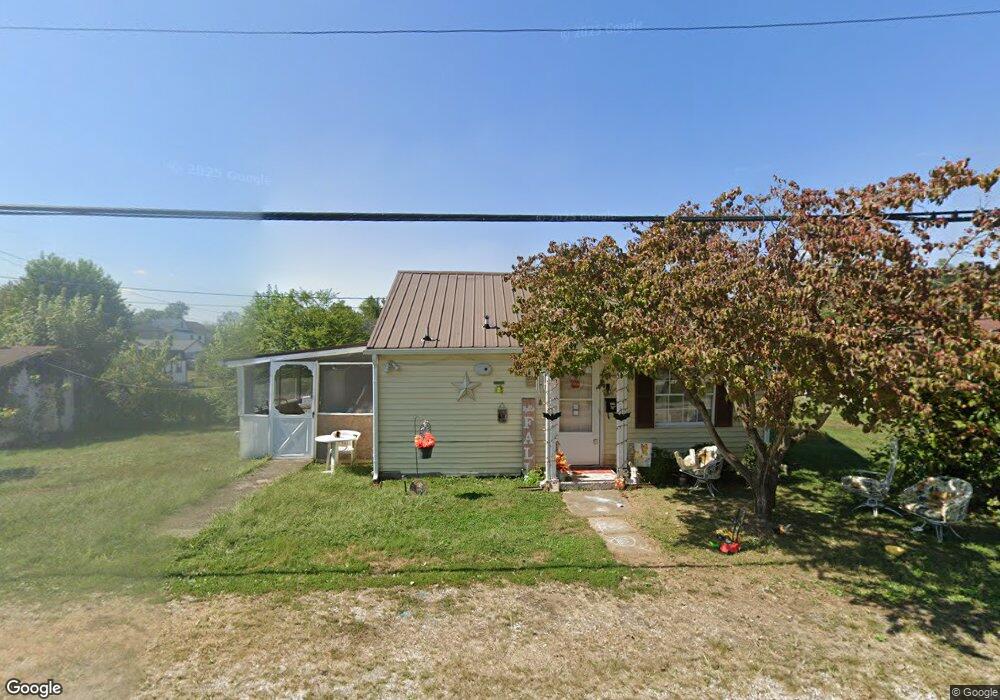
324 Clark St Ironton, OH 45638
Estimated Value: $107,000 - $146,000
3
Beds
1
Bath
1,536
Sq Ft
$80/Sq Ft
Est. Value
About This Home
This home is located at 324 Clark St, Ironton, OH 45638 and is currently estimated at $123,405, approximately $80 per square foot. 324 Clark St is a home located in Lawrence County with nearby schools including Ironton Elementary School, Ironton Middle School, and Ironton High School.
Ownership History
Date
Name
Owned For
Owner Type
Purchase Details
Closed on
Apr 1, 2013
Sold by
Delarosa Rebecca and Church Gary Michael
Bought by
Mannon Richard D and Mannon Mary R
Current Estimated Value
Purchase Details
Closed on
May 6, 2010
Sold by
Patrick Alena Sue
Bought by
Crabtree Gary Scott and Crabtree Robert Christopher
Purchase Details
Closed on
Apr 1, 2008
Sold by
Patrick Kenneth and Patrick Alena Sue
Bought by
Patrick Alena Sue
Home Financials for this Owner
Home Financials are based on the most recent Mortgage that was taken out on this home.
Original Mortgage
$44,100
Interest Rate
5.62%
Mortgage Type
Purchase Money Mortgage
Purchase Details
Closed on
Mar 3, 2008
Sold by
Abrams Anna M and Abrams Reese
Bought by
Patrick Kenneth and Patrick Alena Sue
Home Financials for this Owner
Home Financials are based on the most recent Mortgage that was taken out on this home.
Original Mortgage
$44,100
Interest Rate
5.62%
Mortgage Type
Purchase Money Mortgage
Purchase Details
Closed on
Apr 1, 1996
Sold by
Pierson Nellie
Bought by
Pierson Nellie Life Esta
Create a Home Valuation Report for This Property
The Home Valuation Report is an in-depth analysis detailing your home's value as well as a comparison with similar homes in the area
Home Values in the Area
Average Home Value in this Area
Purchase History
| Date | Buyer | Sale Price | Title Company |
|---|---|---|---|
| Mannon Richard D | $40,000 | None Available | |
| Crabtree Gary Scott | -- | Attorney | |
| Patrick Alena Sue | -- | Attorney | |
| Patrick Kenneth | $32,000 | Attorney | |
| Pierson Nellie Life Esta | -- | -- |
Source: Public Records
Mortgage History
| Date | Status | Borrower | Loan Amount |
|---|---|---|---|
| Previous Owner | Patrick Kenneth | $44,100 |
Source: Public Records
Tax History Compared to Growth
Tax History
| Year | Tax Paid | Tax Assessment Tax Assessment Total Assessment is a certain percentage of the fair market value that is determined by local assessors to be the total taxable value of land and additions on the property. | Land | Improvement |
|---|---|---|---|---|
| 2024 | -- | $24,070 | $4,240 | $19,830 |
| 2023 | $547 | $24,070 | $4,240 | $19,830 |
| 2022 | $561 | $24,070 | $4,240 | $19,830 |
| 2021 | $487 | $21,700 | $3,540 | $18,160 |
| 2020 | $502 | $21,700 | $3,540 | $18,160 |
| 2019 | $241 | $21,700 | $3,540 | $18,160 |
| 2018 | $432 | $19,730 | $3,220 | $16,510 |
| 2017 | $431 | $19,730 | $3,220 | $16,510 |
| 2016 | $402 | $19,730 | $3,220 | $16,510 |
| 2015 | $153 | $12,570 | $3,540 | $9,030 |
| 2014 | $148 | $12,570 | $3,540 | $9,030 |
| 2013 | $147 | $12,570 | $3,540 | $9,030 |
Source: Public Records
Map
Nearby Homes