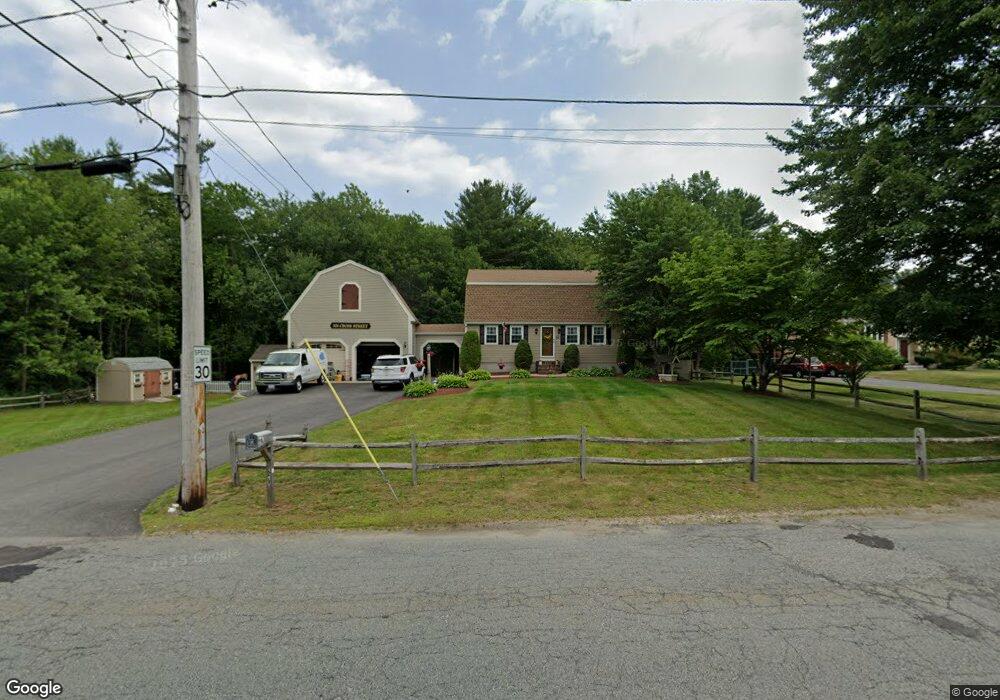
324 Cross St Bridgewater, MA 02324
Estimated Value: $689,000 - $742,000
3
Beds
2
Baths
2,156
Sq Ft
$330/Sq Ft
Est. Value
About This Home
This home is located at 324 Cross St, Bridgewater, MA 02324 and is currently estimated at $710,908, approximately $329 per square foot. 324 Cross St is a home located in Plymouth County with nearby schools including Mitchell Elementary School, Williams Intermediate School, and Bridgewater Middle School.
Ownership History
Date
Name
Owned For
Owner Type
Purchase Details
Closed on
Apr 30, 1998
Sold by
Harmon William F and Harmon Michelle C
Bought by
Sergio Dennis M and Sergio Nancy M
Current Estimated Value
Home Financials for this Owner
Home Financials are based on the most recent Mortgage that was taken out on this home.
Original Mortgage
$120,000
Outstanding Balance
$23,325
Interest Rate
7.04%
Mortgage Type
Purchase Money Mortgage
Estimated Equity
$687,583
Purchase Details
Closed on
Aug 25, 1995
Sold by
Mehrmann Bryan A and Mehrmann Sheri L
Bought by
Harmon William F and Harmon Michelle C
Home Financials for this Owner
Home Financials are based on the most recent Mortgage that was taken out on this home.
Original Mortgage
$159,950
Interest Rate
7.32%
Mortgage Type
Purchase Money Mortgage
Purchase Details
Closed on
Oct 13, 1989
Sold by
Construc Briarwood
Bought by
Mehrmann Bryan A
Create a Home Valuation Report for This Property
The Home Valuation Report is an in-depth analysis detailing your home's value as well as a comparison with similar homes in the area
Home Values in the Area
Average Home Value in this Area
Purchase History
| Date | Buyer | Sale Price | Title Company |
|---|---|---|---|
| Sergio Dennis M | $163,000 | -- | |
| Harmon William F | $148,000 | -- | |
| Mehrmann Bryan A | $172,900 | -- |
Source: Public Records
Mortgage History
| Date | Status | Borrower | Loan Amount |
|---|---|---|---|
| Open | Mehrmann Bryan A | $12,000 | |
| Open | Mehrmann Bryan A | $120,000 | |
| Previous Owner | Mehrmann Bryan A | $159,950 | |
| Previous Owner | Mehrmann Bryan A | $143,400 |
Source: Public Records
Tax History Compared to Growth
Tax History
| Year | Tax Paid | Tax Assessment Tax Assessment Total Assessment is a certain percentage of the fair market value that is determined by local assessors to be the total taxable value of land and additions on the property. | Land | Improvement |
|---|---|---|---|---|
| 2025 | $7,233 | $611,400 | $197,100 | $414,300 |
| 2024 | $7,025 | $578,700 | $187,700 | $391,000 |
| 2023 | $7,097 | $552,700 | $175,400 | $377,300 |
| 2022 | $7,008 | $489,400 | $153,900 | $335,500 |
| 2021 | $6,331 | $437,200 | $137,400 | $299,800 |
| 2020 | $6,206 | $421,300 | $132,100 | $289,200 |
| 2019 | $6,100 | $411,300 | $132,100 | $279,200 |
| 2018 | $5,874 | $386,700 | $121,900 | $264,800 |
| 2017 | $5,643 | $361,500 | $121,900 | $239,600 |
| 2016 | $5,385 | $346,500 | $119,500 | $227,000 |
| 2015 | $5,410 | $333,100 | $116,000 | $217,100 |
| 2014 | $5,202 | $320,100 | $106,700 | $213,400 |
Source: Public Records
Map
Nearby Homes
- 25 Evergreen Dr
- 24 Atkinson Dr
- 115 Cross St
- 905 Vernon St
- 5 Jaclyn Way
- 35 Stockbridge Rd
- 1405 Vernon St
- 1075 South St
- 34 Beninati Farm Rd
- 88 Boxwood Ln
- 54 Grange Park
- 357 Vernon St
- 110 Cobblestone Ln
- 1679 Bedford St
- 50 Stephanie Ln
- 40 Country Club Dr
- 165 Grange Park
- 25 Twin Diamond Dr
- 74 Vernon St
- 489 Flagg St