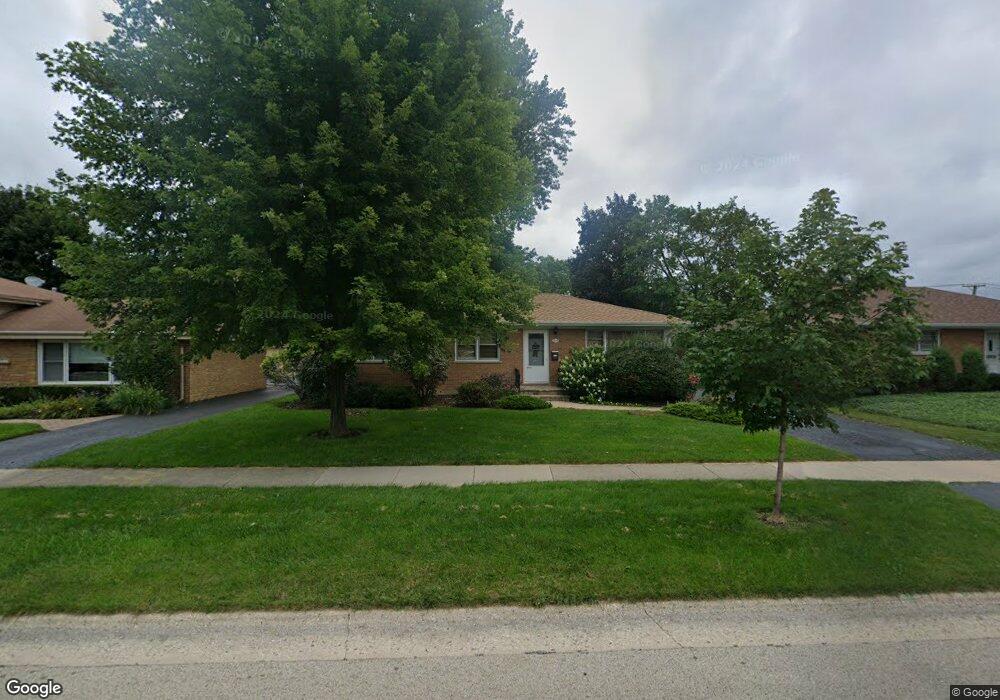
324 Dawes St Libertyville, IL 60048
South Libertyville NeighborhoodEstimated Value: $392,000 - $440,000
--
Bed
1
Bath
1,100
Sq Ft
$379/Sq Ft
Est. Value
About This Home
This home is located at 324 Dawes St, Libertyville, IL 60048 and is currently estimated at $417,229, approximately $379 per square foot. 324 Dawes St is a home located in Lake County with nearby schools including Rockland Elementary School, Highland Middle School, and Libertyville High School.
Ownership History
Date
Name
Owned For
Owner Type
Purchase Details
Closed on
Nov 12, 2021
Sold by
Kenneth Chapin Jr and Kenneth Valorie
Bought by
Chapin Kenneth and Chapin Valorie
Current Estimated Value
Home Financials for this Owner
Home Financials are based on the most recent Mortgage that was taken out on this home.
Original Mortgage
$227,920
Interest Rate
2.88%
Mortgage Type
FHA
Purchase Details
Closed on
Aug 30, 2016
Sold by
Chapin A Kenneth and Chapin Diane
Bought by
Chapin Kenneth and Chapin Valorie
Home Financials for this Owner
Home Financials are based on the most recent Mortgage that was taken out on this home.
Original Mortgage
$189,300
Interest Rate
3.48%
Mortgage Type
New Conventional
Purchase Details
Closed on
Jul 30, 2013
Sold by
Hriljac Susan and Margaret Keyes Trust
Bought by
Chapin A Kenneth and Chapin Diane
Purchase Details
Closed on
Feb 4, 1997
Sold by
Keyes Margaret
Bought by
Keyes Margaret and Margaret Keyes Declaration Of
Create a Home Valuation Report for This Property
The Home Valuation Report is an in-depth analysis detailing your home's value as well as a comparison with similar homes in the area
Home Values in the Area
Average Home Value in this Area
Purchase History
| Date | Buyer | Sale Price | Title Company |
|---|---|---|---|
| Chapin Kenneth | -- | Bc Law Firm Pa | |
| Chapin Kenneth | $236,625 | Greater Metropolitan Title L | |
| Chapin A Kenneth | $207,500 | Multiple | |
| Keyes Margaret | -- | -- |
Source: Public Records
Mortgage History
| Date | Status | Borrower | Loan Amount |
|---|---|---|---|
| Previous Owner | Chapin Kenneth | $227,920 | |
| Previous Owner | Chapin Kenneth | $189,300 |
Source: Public Records
Tax History Compared to Growth
Tax History
| Year | Tax Paid | Tax Assessment Tax Assessment Total Assessment is a certain percentage of the fair market value that is determined by local assessors to be the total taxable value of land and additions on the property. | Land | Improvement |
|---|---|---|---|---|
| 2024 | $8,427 | $122,123 | $80,569 | $41,554 |
| 2023 | $8,427 | $112,639 | $74,312 | $38,327 |
| 2022 | $8,187 | $108,365 | $71,427 | $36,938 |
| 2021 | $7,878 | $106,032 | $69,889 | $36,143 |
| 2020 | $7,579 | $104,249 | $68,714 | $35,535 |
| 2019 | $7,391 | $103,258 | $68,061 | $35,197 |
| 2018 | $7,328 | $105,802 | $69,757 | $36,045 |
| 2017 | $7,224 | $102,462 | $67,555 | $34,907 |
| 2016 | $7,435 | $97,148 | $64,051 | $33,097 |
| 2015 | $7,389 | $90,801 | $59,866 | $30,935 |
| 2014 | $6,143 | $83,722 | $55,199 | $28,523 |
| 2012 | $5,737 | $80,614 | $51,553 | $29,061 |
Source: Public Records
Map
Nearby Homes
- 423 Ames St
- 551 W Park Ave Unit E
- 0 Ames St
- 308 Mckinley Ave
- 1137 Pine Tree Ln
- 1754 Glenmore Rd
- 226 W Maple Ave
- 212 Elm Ct
- 212 W Maple Ave
- 1330 W Park Ave
- 420 W Cook Ave
- 505 Lange Ct
- 747 Garfield Ave Unit C
- 777 Garfield Ave Unit A
- 223 Kenloch Ave
- 20924 & 20902 W Park Ave
- 851 Garfield Ave Unit C
- 323 W Golf Rd
- 1017 Juniper Pkwy
- 217 E Church St