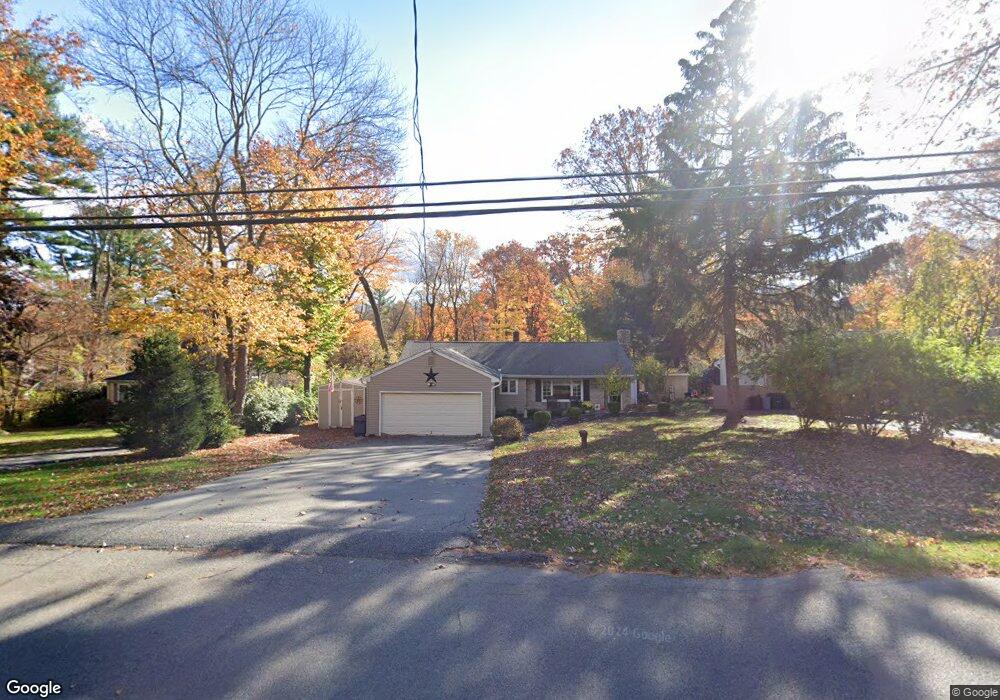
324 Eyland Ave Succasunna, NJ 07876
Estimated Value: $498,372 - $592,000
Studio
--
Bath
1,292
Sq Ft
$415/Sq Ft
Est. Value
About This Home
This home is located at 324 Eyland Ave, Succasunna, NJ 07876 and is currently estimated at $535,593, approximately $414 per square foot. 324 Eyland Ave is a home located in Morris County with nearby schools including Lincoln Roosevelt Elementary School, Eisenhower Middle School, and Roxbury High School.
Ownership History
Date
Name
Owned For
Owner Type
Purchase Details
Closed on
Nov 3, 2005
Sold by
Lasso Cesar
Bought by
Osterman Brian J and Osterman Georgia
Current Estimated Value
Home Financials for this Owner
Home Financials are based on the most recent Mortgage that was taken out on this home.
Original Mortgage
$360,000
Interest Rate
7.25%
Mortgage Type
Adjustable Rate Mortgage/ARM
Purchase Details
Closed on
Feb 11, 2004
Sold by
Villano Vito
Bought by
Lasso Cesar
Create a Home Valuation Report for This Property
The Home Valuation Report is an in-depth analysis detailing your home's value as well as a comparison with similar homes in the area
Home Values in the Area
Average Home Value in this Area
Purchase History
| Date | Buyer | Sale Price | Title Company |
|---|---|---|---|
| Osterman Brian J | $360,000 | -- | |
| Lasso Cesar | $250,000 | -- |
Source: Public Records
Mortgage History
| Date | Status | Borrower | Loan Amount |
|---|---|---|---|
| Previous Owner | Osterman Brian J | $360,000 |
Source: Public Records
Tax History Compared to Growth
Tax History
| Year | Tax Paid | Tax Assessment Tax Assessment Total Assessment is a certain percentage of the fair market value that is determined by local assessors to be the total taxable value of land and additions on the property. | Land | Improvement |
|---|---|---|---|---|
| 2025 | $8,989 | $327,000 | $103,100 | $223,900 |
| 2024 | $8,849 | $327,000 | $103,100 | $223,900 |
Source: Public Records
Map
Nearby Homes
- 45 Parkview Dr
- 174 S Hillside Ave
- 28 Toby Dr
- 157 S Hillside Ave
- 29 Joyce Dr
- 50 Henry St
- 6 Ironia Rd
- 29 Eyland Ave
- 150 U S Highway 206
- 146 U S Highway 206
- 6 Prides Crossing
- 48 Drake Way
- 2 Robert St
- 148 Eyland Ave
- 30 Pasture Ct
- 11 Renault Dr
- 14 Bordeaux Dr
- 30 Woods Edge Dr
- 26 Woods Edge Dr
- 50 Carol Dr