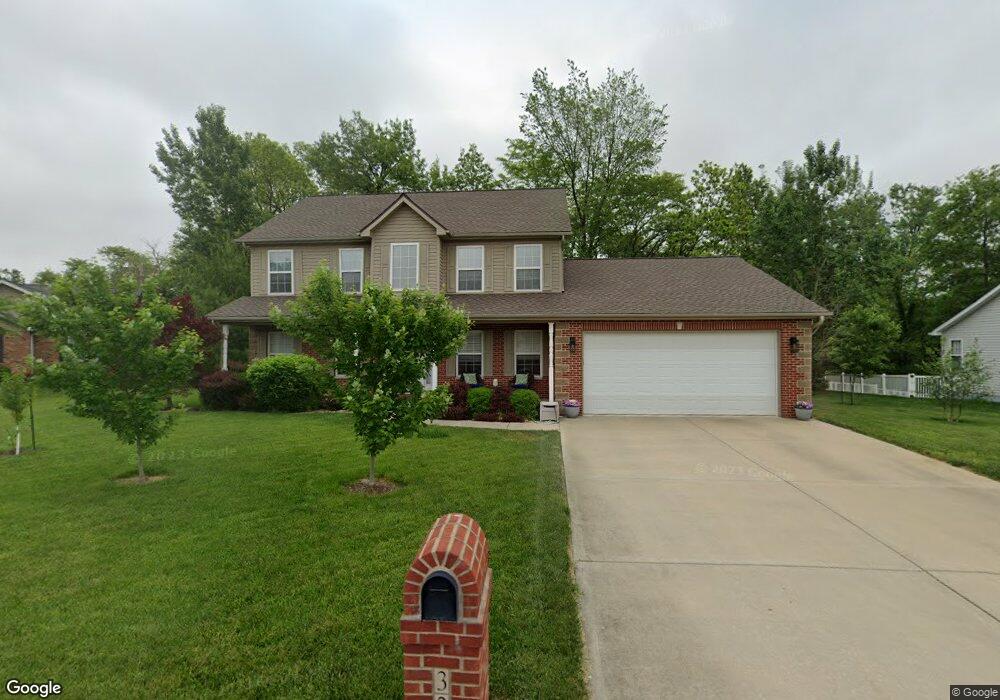
324 Glenrock Ln Freeburg, IL 62243
Estimated Value: $366,172 - $446,000
3
Beds
3
Baths
2,652
Sq Ft
$151/Sq Ft
Est. Value
About This Home
This home is located at 324 Glenrock Ln, Freeburg, IL 62243 and is currently estimated at $399,293, approximately $150 per square foot. 324 Glenrock Ln is a home located in St. Clair County with nearby schools including Freeburg Elementary School, Freeburg Community High School, and St. Joseph Catholic School.
Ownership History
Date
Name
Owned For
Owner Type
Purchase Details
Closed on
Feb 22, 2012
Sold by
Beneficial Financial 1 Inc
Bought by
Hilpert Timothy M and Hilpert Deborah K
Current Estimated Value
Home Financials for this Owner
Home Financials are based on the most recent Mortgage that was taken out on this home.
Original Mortgage
$138,200
Interest Rate
3.95%
Mortgage Type
New Conventional
Purchase Details
Closed on
Aug 12, 2011
Sold by
Severit Dwight
Bought by
Beneficial Financial 1 Inc
Purchase Details
Closed on
Dec 15, 2006
Sold by
Cmi Construction Inc
Bought by
Severit Dwight and Severit Brandon
Home Financials for this Owner
Home Financials are based on the most recent Mortgage that was taken out on this home.
Original Mortgage
$235,000
Interest Rate
6.33%
Mortgage Type
Balloon
Create a Home Valuation Report for This Property
The Home Valuation Report is an in-depth analysis detailing your home's value as well as a comparison with similar homes in the area
Home Values in the Area
Average Home Value in this Area
Purchase History
| Date | Buyer | Sale Price | Title Company |
|---|---|---|---|
| Hilpert Timothy M | $192,000 | Premier Title | |
| Beneficial Financial 1 Inc | -- | Premier Title | |
| Severit Dwight | $235,000 | Benchmark Title Company |
Source: Public Records
Mortgage History
| Date | Status | Borrower | Loan Amount |
|---|---|---|---|
| Previous Owner | Hilpert Timothy M | $138,200 | |
| Previous Owner | Severit Dwight | $235,000 |
Source: Public Records
Tax History Compared to Growth
Tax History
| Year | Tax Paid | Tax Assessment Tax Assessment Total Assessment is a certain percentage of the fair market value that is determined by local assessors to be the total taxable value of land and additions on the property. | Land | Improvement |
|---|---|---|---|---|
| 2024 | $8,240 | $105,787 | $16,792 | $88,995 |
| 2023 | $7,744 | $98,324 | $15,607 | $82,717 |
| 2022 | $7,238 | $90,239 | $14,324 | $75,915 |
| 2021 | $6,938 | $84,971 | $13,488 | $71,483 |
| 2020 | $6,010 | $71,717 | $17,350 | $54,367 |
| 2019 | $5,824 | $71,717 | $17,350 | $54,367 |
| 2018 | $5,605 | $69,205 | $16,742 | $52,463 |
| 2017 | $5,784 | $66,000 | $15,967 | $50,033 |
| 2016 | $6,203 | $73,488 | $16,245 | $57,243 |
| 2014 | $5,333 | $72,316 | $15,986 | $56,330 |
| 2013 | $7,176 | $73,890 | $16,334 | $57,556 |
Source: Public Records
Map
Nearby Homes
- 359 Sleeping Indian Dr
- 363 Sleeping Indian Dr
- 304 Torrington Ln
- 420 Foxtail Dr
- 433 Foxtail Dr
- 222 Alamosa Dr
- 227 Alamosa Dr
- 440 Foxtail Dr
- 302 N Railroad St
- 312 W Phillips St
- 206 N Main St
- 207 N Edison St
- 401 N Edison St
- 520 N Edison St
- 106 S Vine St
- TBB Kraft Rd
- 5433 Kraft Rd
- 3 Park St
- 103 Draco Dr
- 0 Hickory Dr
- 320 Glenrock Ln
- 328 Glenrock Ln
- 327 Chimney Rock Dr
- 325 Glenrock Ln
- 316 Glenrock Ln
- 321 Chimney Rock Dr
- 321 Glenrock Ln
- 333 Glenrock Ln
- 329 Glenrock Ln
- 317 Glenrock Ln
- 331 Chimney Rock Dr
- 315 Chimney Rock Dr
- 312 Glenrock Ln
- 324 Sleeping Indian Dr
- 335 Chimney Rock Dr
- 328 Sleeping Indian Dr
- 320 Sleeping Indian Dr
- 313 Glenrock Ln
- 316 Sleeping Indian Dr
- 308 Glenrock Ln