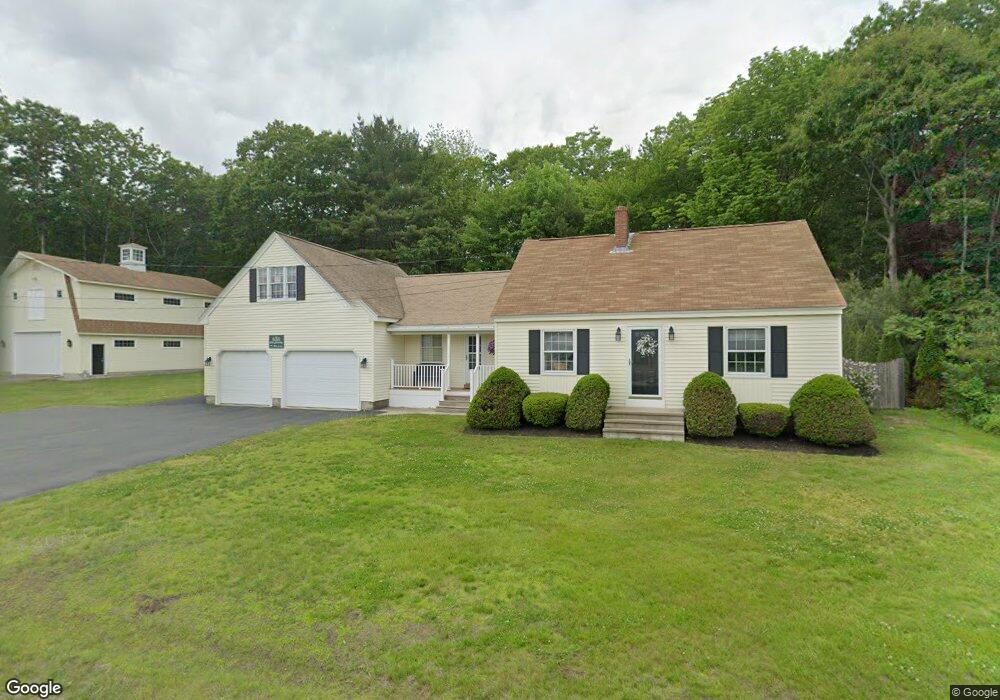
324 Guinea Rd Biddeford, ME 04005
South Biddeford NeighborhoodEstimated Value: $526,000 - $670,000
3
Beds
2
Baths
2,064
Sq Ft
$288/Sq Ft
Est. Value
About This Home
This home is located at 324 Guinea Rd, Biddeford, ME 04005 and is currently estimated at $593,671, approximately $287 per square foot. 324 Guinea Rd is a home located in York County with nearby schools including John F Kennedy Memorial School, Biddeford Primary School, and Biddeford Intermediate School.
Ownership History
Date
Name
Owned For
Owner Type
Purchase Details
Closed on
Oct 8, 2020
Sold by
Boucher Brian R and Boucher Susan M
Bought by
Larsen Erik A
Current Estimated Value
Home Financials for this Owner
Home Financials are based on the most recent Mortgage that was taken out on this home.
Original Mortgage
$243,000
Outstanding Balance
$216,136
Interest Rate
2.9%
Mortgage Type
New Conventional
Estimated Equity
$377,535
Create a Home Valuation Report for This Property
The Home Valuation Report is an in-depth analysis detailing your home's value as well as a comparison with similar homes in the area
Home Values in the Area
Average Home Value in this Area
Purchase History
| Date | Buyer | Sale Price | Title Company |
|---|---|---|---|
| Larsen Erik A | -- | None Available |
Source: Public Records
Mortgage History
| Date | Status | Borrower | Loan Amount |
|---|---|---|---|
| Open | Larsen Erik A | $243,000 |
Source: Public Records
Tax History Compared to Growth
Tax History
| Year | Tax Paid | Tax Assessment Tax Assessment Total Assessment is a certain percentage of the fair market value that is determined by local assessors to be the total taxable value of land and additions on the property. | Land | Improvement |
|---|---|---|---|---|
| 2024 | $6,365 | $447,600 | $166,100 | $281,500 |
| 2023 | $5,873 | $447,600 | $166,100 | $281,500 |
| 2022 | $5,318 | $324,100 | $90,300 | $233,800 |
| 2021 | $5,048 | $276,900 | $75,400 | $201,500 |
| 2020 | $5,035 | $251,100 | $64,000 | $187,100 |
| 2019 | $5,017 | $251,100 | $64,000 | $187,100 |
| 2018 | $4,947 | $251,100 | $64,000 | $187,100 |
| 2017 | $4,931 | $245,700 | $64,000 | $181,700 |
| 2016 | $4,880 | $245,700 | $64,000 | $181,700 |
| 2015 | $4,589 | $245,700 | $64,000 | $181,700 |
| 2014 | $4,476 | $245,700 | $64,000 | $181,700 |
| 2013 | -- | $244,000 | $59,700 | $184,300 |
Source: Public Records
Map
Nearby Homes