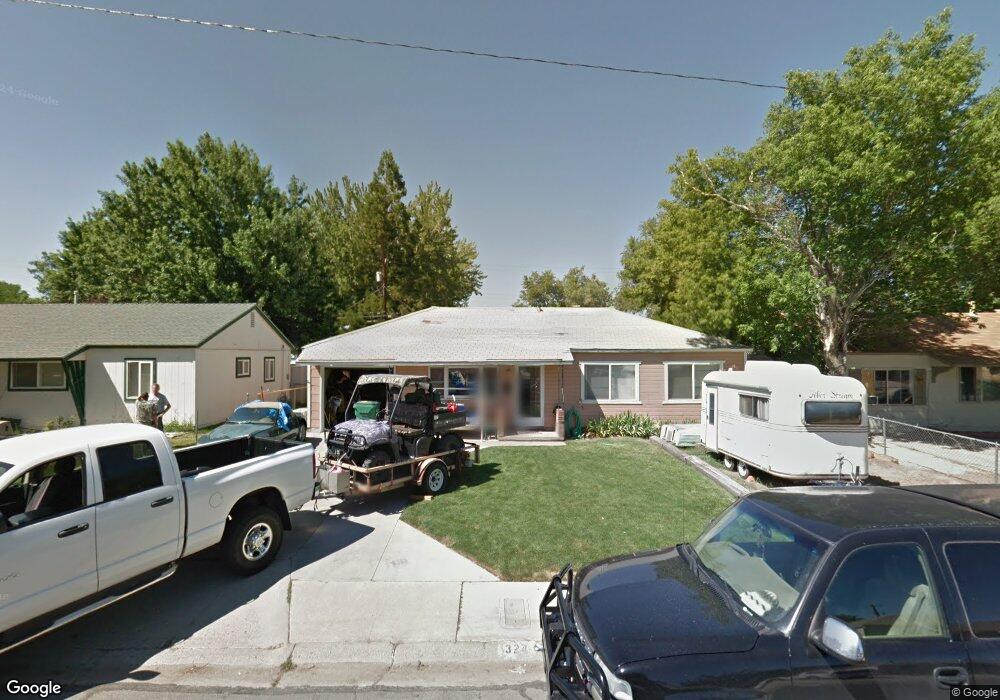
324 K St Unit St. Sparks, NV 89431
McCarran Boulevard-Probasco NeighborhoodEstimated Value: $342,000 - $369,000
3
Beds
1
Bath
900
Sq Ft
$399/Sq Ft
Est. Value
About This Home
This home is located at 324 K St Unit St., Sparks, NV 89431 and is currently estimated at $359,190, approximately $399 per square foot. 324 K St Unit St. is a home located in Washoe County with nearby schools including Greenbrae Elementary School, George L Dilworth Middle School, and Sparks High School.
Ownership History
Date
Name
Owned For
Owner Type
Purchase Details
Closed on
May 8, 2025
Sold by
Rials Family Trust and Rials Sandra D
Bought by
Pandaan Darrell
Current Estimated Value
Home Financials for this Owner
Home Financials are based on the most recent Mortgage that was taken out on this home.
Original Mortgage
$287,920
Outstanding Balance
$286,121
Interest Rate
6.65%
Mortgage Type
New Conventional
Estimated Equity
$73,069
Purchase Details
Closed on
Mar 21, 1997
Sold by
Wang Renee M
Bought by
Rials Randall J
Home Financials for this Owner
Home Financials are based on the most recent Mortgage that was taken out on this home.
Original Mortgage
$92,700
Interest Rate
7.15%
Purchase Details
Closed on
Mar 14, 1997
Sold by
Armstrong George
Bought by
Rials Randall J and Wang Renee M
Home Financials for this Owner
Home Financials are based on the most recent Mortgage that was taken out on this home.
Original Mortgage
$92,700
Interest Rate
7.15%
Create a Home Valuation Report for This Property
The Home Valuation Report is an in-depth analysis detailing your home's value as well as a comparison with similar homes in the area
Home Values in the Area
Average Home Value in this Area
Purchase History
| Date | Buyer | Sale Price | Title Company |
|---|---|---|---|
| Pandaan Darrell | $360,000 | First American Title | |
| Rials Randall J | -- | Stewart Title Northern Nevad | |
| Rials Randall J | $83,000 | United Title |
Source: Public Records
Mortgage History
| Date | Status | Borrower | Loan Amount |
|---|---|---|---|
| Open | Pandaan Darrell | $287,920 | |
| Previous Owner | Rials Randall J | $92,700 | |
| Previous Owner | Rials Randall J | $78,850 |
Source: Public Records
Tax History
| Year | Tax Paid | Tax Assessment Tax Assessment Total Assessment is a certain percentage of the fair market value that is determined by local assessors to be the total taxable value of land and additions on the property. | Land | Improvement |
|---|---|---|---|---|
| 2026 | $456 | $46,822 | $34,090 | $12,732 |
| 2025 | $569 | $46,243 | $33,565 | $12,678 |
| 2024 | $569 | $42,528 | $30,065 | $12,464 |
| 2023 | $553 | $42,866 | $31,325 | $11,541 |
| 2022 | $537 | $35,602 | $26,180 | $9,422 |
| 2021 | $522 | $27,125 | $17,955 | $9,170 |
| 2020 | $508 | $25,936 | $16,940 | $8,996 |
| 2019 | $493 | $24,393 | $15,890 | $8,503 |
| 2018 | $478 | $19,874 | $11,725 | $8,149 |
| 2017 | $466 | $18,395 | $10,395 | $8,000 |
| 2016 | $453 | $17,365 | $9,345 | $8,020 |
| 2015 | $452 | $15,670 | $7,700 | $7,970 |
| 2014 | $438 | $13,951 | $6,440 | $7,511 |
| 2013 | -- | $11,613 | $4,270 | $7,343 |
Source: Public Records
Map
Nearby Homes
Your Personal Tour Guide
Ask me questions while you tour the home.