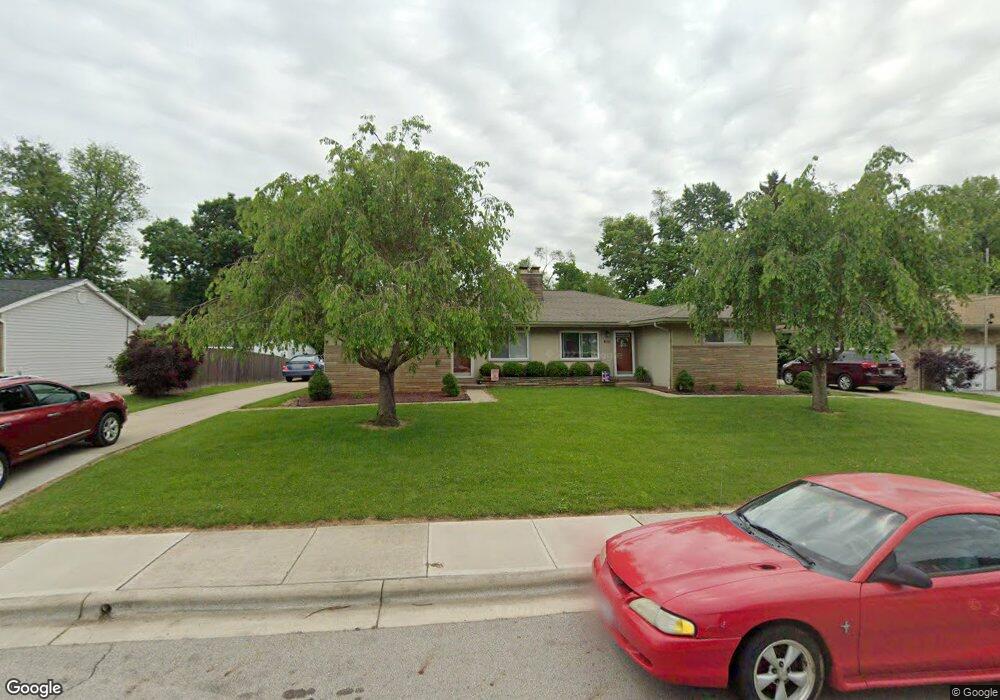
324 Kessler St Unit 326 Groveport, OH 43125
Estimated Value: $295,000 - $397,000
6
Beds
2
Baths
2,512
Sq Ft
$135/Sq Ft
Est. Value
About This Home
This home is located at 324 Kessler St Unit 326, Groveport, OH 43125 and is currently estimated at $339,022, approximately $134 per square foot. 324 Kessler St Unit 326 is a home located in Franklin County with nearby schools including Groveport Madison High School, Groveport Community School, and Madison Christian School.
Ownership History
Date
Name
Owned For
Owner Type
Purchase Details
Closed on
Nov 2, 1999
Sold by
Phelps Mary Beth and Queen Theresa Lynn
Bought by
Corbett Jeannie C
Current Estimated Value
Home Financials for this Owner
Home Financials are based on the most recent Mortgage that was taken out on this home.
Original Mortgage
$114,000
Interest Rate
7.88%
Mortgage Type
Purchase Money Mortgage
Purchase Details
Closed on
Feb 9, 1982
Bought by
Phelps Mary J
Create a Home Valuation Report for This Property
The Home Valuation Report is an in-depth analysis detailing your home's value as well as a comparison with similar homes in the area
Home Values in the Area
Average Home Value in this Area
Purchase History
| Date | Buyer | Sale Price | Title Company |
|---|---|---|---|
| Corbett Jeannie C | $142,500 | Title First Agency Inc | |
| Phelps Mary J | -- | -- |
Source: Public Records
Mortgage History
| Date | Status | Borrower | Loan Amount |
|---|---|---|---|
| Previous Owner | Corbett Jeannie C | $114,000 |
Source: Public Records
Tax History Compared to Growth
Tax History
| Year | Tax Paid | Tax Assessment Tax Assessment Total Assessment is a certain percentage of the fair market value that is determined by local assessors to be the total taxable value of land and additions on the property. | Land | Improvement |
|---|---|---|---|---|
| 2024 | $5,087 | $101,710 | $29,050 | $72,660 |
| 2023 | $5,043 | $101,710 | $29,050 | $72,660 |
| 2022 | $3,831 | $61,640 | $11,030 | $50,610 |
| 2021 | $3,845 | $61,640 | $11,030 | $50,610 |
| 2020 | $3,854 | $61,640 | $11,030 | $50,610 |
| 2019 | $3,646 | $51,390 | $9,210 | $42,180 |
| 2018 | $3,609 | $51,390 | $9,210 | $42,180 |
| 2017 | $3,598 | $51,390 | $9,210 | $42,180 |
| 2016 | $3,520 | $44,700 | $10,080 | $34,620 |
| 2015 | $3,552 | $44,700 | $10,080 | $34,620 |
| 2014 | $3,349 | $44,700 | $10,080 | $34,620 |
| 2013 | $1,508 | $47,040 | $10,605 | $36,435 |
Source: Public Records
Map
Nearby Homes