Estimated Value: $330,000 - $416,000
3
Beds
2
Baths
1,614
Sq Ft
$240/Sq Ft
Est. Value
About This Home
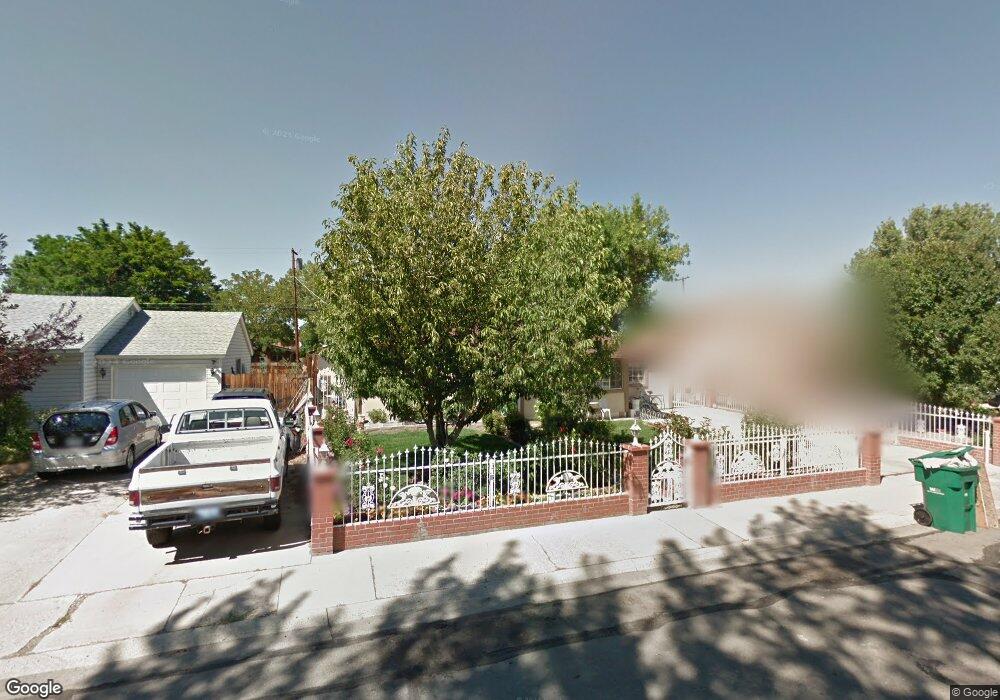
This home is located at 324 L St, Sparks, NV 89431 and is currently estimated at $388,057, approximately $240 per square foot. 324 L St is a home located in Washoe County with nearby schools including Greenbrae Elementary School, George L Dilworth Middle School, and Sparks High School.
Ownership History
Date
Name
Owned For
Owner Type
Purchase Details
Closed on
Nov 2, 2020
Sold by
Murillo Raul G
Bought by
Murillo Raul G and Murillo Alvarado Jennifer
Current Estimated Value
Purchase Details
Closed on
Jul 19, 2013
Sold by
Murillo Raul G and Murillo Gonzalez Raul
Bought by
Murillo Raul G
Home Financials for this Owner
Home Financials are based on the most recent Mortgage that was taken out on this home.
Original Mortgage
$106,000
Interest Rate
3.88%
Mortgage Type
New Conventional
Purchase Details
Closed on
Jul 6, 2010
Sold by
Murillo Angelica S
Bought by
Murillo Gonzalez Raul
Purchase Details
Closed on
Jan 27, 2003
Sold by
Murillo Gonzalez Raul and Murillo Raul
Bought by
Murillo Gonzalez Raul and Murillo Angelica
Home Financials for this Owner
Home Financials are based on the most recent Mortgage that was taken out on this home.
Original Mortgage
$63,000
Interest Rate
5.97%
Create a Home Valuation Report for This Property
The Home Valuation Report is an in-depth analysis detailing your home's value as well as a comparison with similar homes in the area
Home Values in the Area
Average Home Value in this Area
Purchase History
| Date | Buyer | Sale Price | Title Company |
|---|---|---|---|
| Murillo Raul G | $96,338 | None Available | |
| Murillo Raul G | -- | North American Title | |
| Murillo Gonzalez Raul | -- | None Available | |
| Murillo Gonzalez Raul | -- | First Centennial Title Co |
Source: Public Records
Mortgage History
| Date | Status | Borrower | Loan Amount |
|---|---|---|---|
| Previous Owner | Murillo Raul G | $106,000 | |
| Previous Owner | Murillo Gonzalez Raul | $63,000 |
Source: Public Records
Tax History
| Year | Tax Paid | Tax Assessment Tax Assessment Total Assessment is a certain percentage of the fair market value that is determined by local assessors to be the total taxable value of land and additions on the property. | Land | Improvement |
|---|---|---|---|---|
| 2026 | $685 | $61,805 | $34,090 | $27,715 |
| 2024 | $893 | $51,734 | $30,065 | $21,669 |
| 2023 | $868 | $51,375 | $31,325 | $20,050 |
| 2022 | $843 | $42,489 | $26,180 | $16,309 |
| 2021 | $818 | $33,718 | $17,955 | $15,763 |
| 2020 | $793 | $32,571 | $16,940 | $15,631 |
| 2019 | $770 | $30,629 | $15,890 | $14,739 |
| 2018 | $748 | $25,880 | $11,725 | $14,155 |
| 2017 | $728 | $24,481 | $10,395 | $14,086 |
| 2016 | $709 | $23,455 | $9,345 | $14,110 |
| 2015 | $707 | $21,460 | $7,700 | $13,760 |
| 2014 | $687 | $20,092 | $6,440 | $13,652 |
| 2013 | -- | $18,268 | $4,270 | $13,998 |
Source: Public Records
Map
Nearby Homes
Your Personal Tour Guide
Ask me questions while you tour the home.