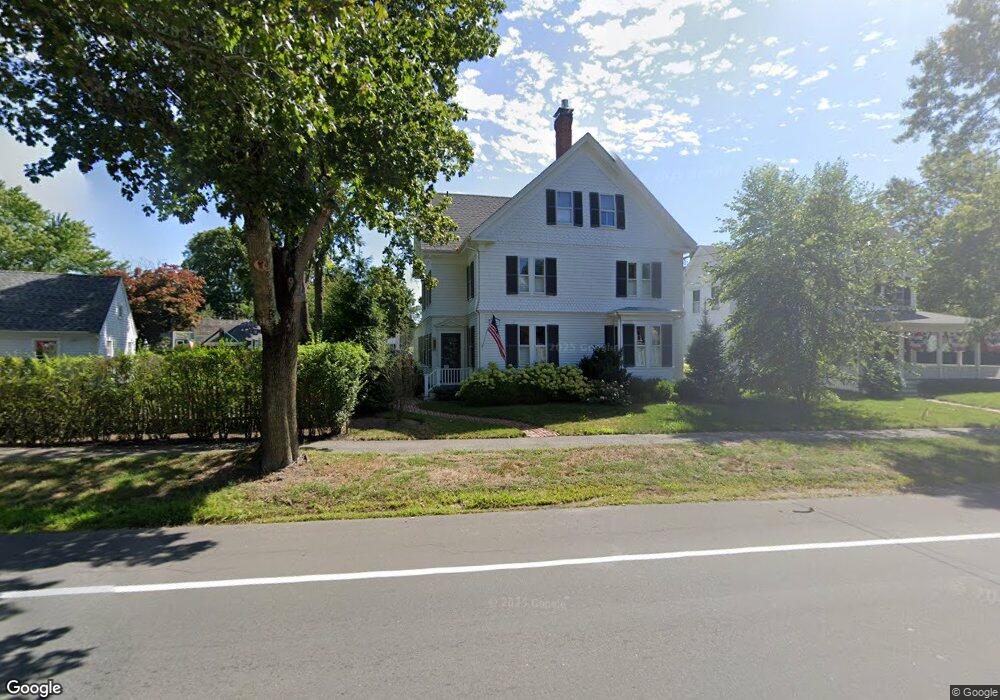
324 Main St Hingham, MA 02043
Estimated Value: $2,075,000 - $2,322,000
6
Beds
3
Baths
3,604
Sq Ft
$618/Sq Ft
Est. Value
About This Home
This home is located at 324 Main St, Hingham, MA 02043 and is currently estimated at $2,226,740, approximately $617 per square foot. 324 Main St is a home located in Plymouth County with nearby schools including East Elementary School, Hingham Middle School, and Hingham High School.
Ownership History
Date
Name
Owned For
Owner Type
Purchase Details
Closed on
Sep 10, 2020
Sold by
Thomas Gregory and Thomas Danielle
Bought by
Leiphart David and Leiphart Marybeth
Current Estimated Value
Home Financials for this Owner
Home Financials are based on the most recent Mortgage that was taken out on this home.
Original Mortgage
$500,000
Outstanding Balance
$437,627
Interest Rate
2.9%
Mortgage Type
New Conventional
Estimated Equity
$1,789,113
Purchase Details
Closed on
Jul 10, 2017
Sold by
Voloshko Alexander and Voloshko Amy
Bought by
Thomas Danielle and Thomas Gregory
Home Financials for this Owner
Home Financials are based on the most recent Mortgage that was taken out on this home.
Original Mortgage
$1,114,000
Interest Rate
3.95%
Mortgage Type
Purchase Money Mortgage
Purchase Details
Closed on
Apr 26, 2012
Sold by
Riley John
Bought by
Voloshko Alexander and Voloshko Amy
Home Financials for this Owner
Home Financials are based on the most recent Mortgage that was taken out on this home.
Original Mortgage
$862,500
Interest Rate
4%
Mortgage Type
Adjustable Rate Mortgage/ARM
Purchase Details
Closed on
Jun 13, 2003
Sold by
Main St Rt and Murphy
Bought by
Riley John
Home Financials for this Owner
Home Financials are based on the most recent Mortgage that was taken out on this home.
Original Mortgage
$450,000
Interest Rate
5.77%
Mortgage Type
Purchase Money Mortgage
Create a Home Valuation Report for This Property
The Home Valuation Report is an in-depth analysis detailing your home's value as well as a comparison with similar homes in the area
Purchase History
| Date | Buyer | Sale Price | Title Company |
|---|---|---|---|
| Leiphart David | $1,450,000 | None Available | |
| Thomas Danielle | $1,392,500 | -- | |
| Voloshko Alexander | $1,150,000 | -- | |
| Riley John | $755,000 | -- |
Source: Public Records
Mortgage History
| Date | Status | Borrower | Loan Amount |
|---|---|---|---|
| Open | Leiphart David | $500,000 | |
| Previous Owner | Thomas Danielle | $1,114,000 | |
| Previous Owner | Voloshko Alexander | $862,500 | |
| Previous Owner | Voloshko Alexander | $172,500 | |
| Previous Owner | Riley John | $925,000 | |
| Previous Owner | Riley John | $450,000 |
Source: Public Records
Tax History
| Year | Tax Paid | Tax Assessment Tax Assessment Total Assessment is a certain percentage of the fair market value that is determined by local assessors to be the total taxable value of land and additions on the property. | Land | Improvement |
|---|---|---|---|---|
| 2025 | $17,735 | $1,659,000 | $756,800 | $902,200 |
| 2024 | $17,784 | $1,639,100 | $756,800 | $882,300 |
| 2023 | $16,113 | $1,611,300 | $756,800 | $854,500 |
| 2022 | $16,181 | $1,399,700 | $688,000 | $711,700 |
| 2021 | $15,736 | $1,333,600 | $649,700 | $683,900 |
| 2020 | $15,376 | $1,333,600 | $649,700 | $683,900 |
| 2019 | $15,609 | $1,321,700 | $649,700 | $672,000 |
| 2018 | $15,323 | $1,301,900 | $649,700 | $652,200 |
| 2017 | $12,613 | $1,029,600 | $551,700 | $477,900 |
| 2016 | $12,531 | $1,003,300 | $525,400 | $477,900 |
| 2015 | $12,467 | $995,000 | $517,100 | $477,900 |
Source: Public Records
Map
Nearby Homes
Your Personal Tour Guide
Ask me questions while you tour the home.