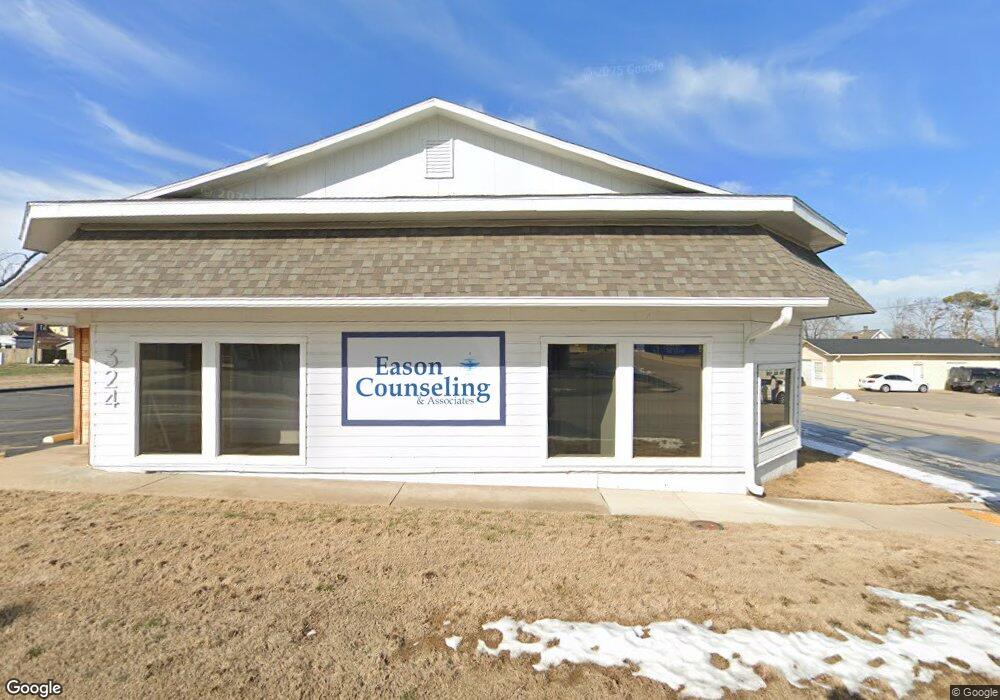
324 N 2nd St Rogers, AR 72756
Estimated Value: $621,514
Studio
--
Bath
5,074
Sq Ft
$122/Sq Ft
Est. Value
About This Home
This home is located at 324 N 2nd St, Rogers, AR 72756 and is currently estimated at $621,514, approximately $122 per square foot. 324 N 2nd St is a home located in Benton County with nearby schools including Frank Tillery Elementary School, Lingle Middle School, and Rogers Heritage High School.
Ownership History
Date
Name
Owned For
Owner Type
Purchase Details
Closed on
May 31, 2019
Sold by
Buffalo Island Partners Llc
Bought by
Spam Investments Llc
Current Estimated Value
Home Financials for this Owner
Home Financials are based on the most recent Mortgage that was taken out on this home.
Original Mortgage
$215,000
Outstanding Balance
$164,451
Interest Rate
4.2%
Mortgage Type
Commercial
Estimated Equity
$457,063
Purchase Details
Closed on
Mar 1, 2018
Sold by
J & L Properties Llc
Bought by
Buffalo Island Partners Llc
Home Financials for this Owner
Home Financials are based on the most recent Mortgage that was taken out on this home.
Original Mortgage
$240,000
Interest Rate
4.04%
Mortgage Type
Future Advance Clause Open End Mortgage
Purchase Details
Closed on
Mar 18, 2002
Bought by
J
Purchase Details
Closed on
Aug 7, 1991
Bought by
Harris
Create a Home Valuation Report for This Property
The Home Valuation Report is an in-depth analysis detailing your home's value as well as a comparison with similar homes in the area
Home Values in the Area
Average Home Value in this Area
Purchase History
| Date | Buyer | Sale Price | Title Company |
|---|---|---|---|
| Spam Investments Llc | $315,000 | Realty Ttl & Closing Svcs Ll | |
| Buffalo Island Partners Llc | $300,000 | Realty Title & Closing Servi | |
| J | $178,000 | -- | |
| Harris | $61,000 | -- |
Source: Public Records
Mortgage History
| Date | Status | Borrower | Loan Amount |
|---|---|---|---|
| Open | Spam Investments Llc | $215,000 | |
| Previous Owner | Buffalo Island Partners Llc | $240,000 |
Source: Public Records
Tax History
| Year | Tax Paid | Tax Assessment Tax Assessment Total Assessment is a certain percentage of the fair market value that is determined by local assessors to be the total taxable value of land and additions on the property. | Land | Improvement |
|---|---|---|---|---|
| 2025 | $4,242 | $108,169 | $8,003 | $100,166 |
| 2024 | $3,794 | $108,169 | $8,003 | $100,166 |
| 2023 | $3,449 | $65,200 | $5,940 | $59,260 |
| 2022 | $3,586 | $65,200 | $5,940 | $59,260 |
| 2021 | $3,577 | $65,200 | $5,940 | $59,260 |
| 2020 | $3,409 | $62,090 | $6,630 | $55,460 |
| 2019 | $3,409 | $62,090 | $6,630 | $55,460 |
| 2018 | $3,409 | $62,090 | $6,630 | $55,460 |
| 2017 | $2,766 | $62,090 | $6,630 | $55,460 |
| 2016 | $2,766 | $62,090 | $6,630 | $55,460 |
| 2015 | $2,563 | $48,450 | $5,850 | $42,600 |
| 2014 | $2,563 | $48,450 | $5,850 | $42,600 |
Source: Public Records
Map
Nearby Homes
- 615 & 615 1/2 N 3rd St
- 615 N 3rd St
- 201 E Walnut St
- 220 N C St
- 403 6th St
- 718 W Maple St
- 509 E Walnut St
- 418,420,422,424 N F St
- 0 E Spring St
- 510 N 8th St
- 511 Spring St
- 0 Sears Unit 1324915
- 803 W Maple St
- 630 W Poplar St
- 516 E Pearl St
- Lot 34, 1109 N 9th St
- Lot 33, 1109 N 9th St
- Lot 35, 1109 N 9th St
- 208 N 9th St
- 525 S 6th St
Your Personal Tour Guide
Ask me questions while you tour the home.