
Seller's Agent in 2019
Michelle Burt
The Firm
(781) 910-9217
1 in this area
45 Total Sales
Estimated Value: $1,088,000 - $1,300,000
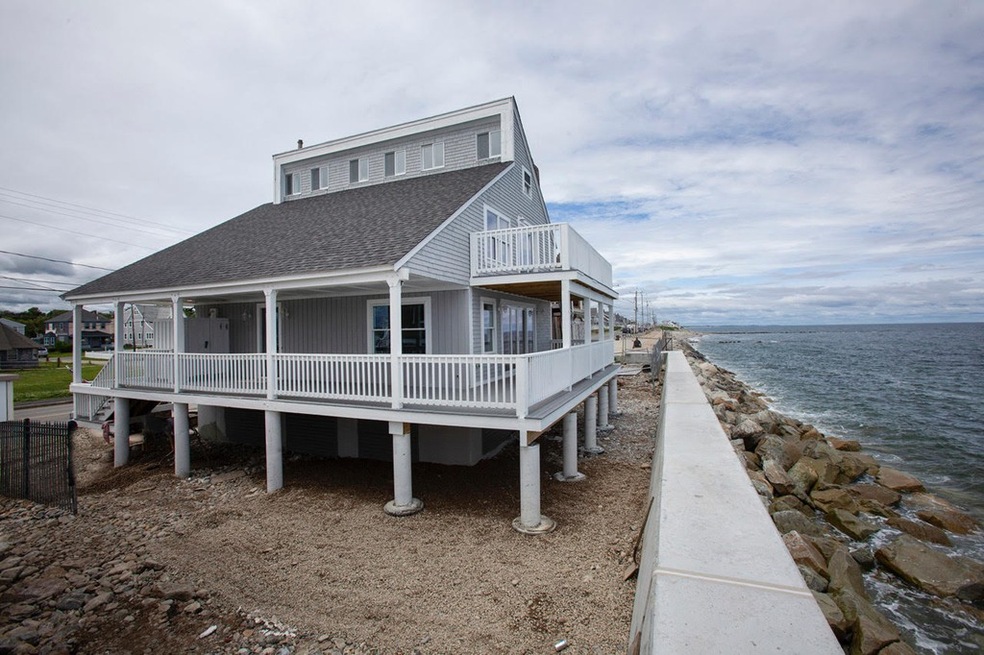
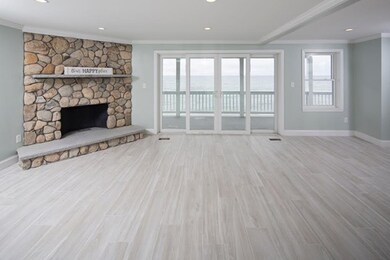
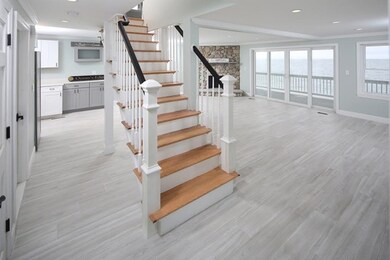
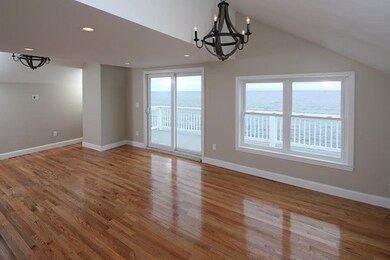
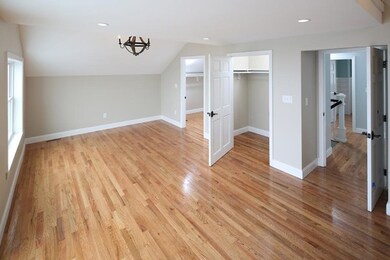
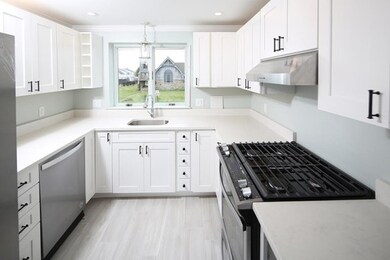
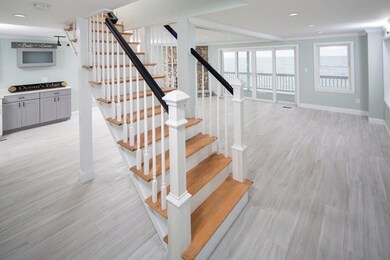
Welcome to Oceans Edge, this custom built direct oceanfront home has been completely remodeled from top to bottom. This light & bright open floor plan is suitable for entertaining w/ fabulous oceanviews, new gourmet white kitchen, new stainless appliances, 2 new full baths, new flooring & doors, new fireplace,new gas furnace,new central air,new electric service,new plumbing,1st floor laundry& freshly painted interior. Exterior features include: new roof, new windows, new sliders, 2 expansive oceanfront decks w/panoramic oceanviews, new outdoor shower, freshly painted exterior and 2 car garage. This unique rare find oceanfront home sits behind a new 8.5 million dollar seawall & has been elevated to comply w/FEMA guidelines & is conveniently located close to Brant Rock Esplanade w/bars, restaurants & shops.Flood ins is $595 per yr per seller & grandfathered.Value Price Range 699-739k
| Date | Buyer | Sale Price | Title Company |
|---|---|---|---|
| Richard Monaham Ret | -- | None Available | |
| Richard Monaham Ret | -- | None Available | |
| Monahan Richard | $675,000 | -- | |
| Tah Ft | $300,000 | -- | |
| Tah Ft | $300,000 | -- | |
| Acrowley Llc | $405,000 | -- | |
| Campbell Gordon S | $206,150 | -- | |
| Campbell Gordon S | $206,150 | -- |
| Date | Status | Borrower | Loan Amount |
|---|---|---|---|
| Previous Owner | Monahan Richard | $525,000 | |
| Previous Owner | Tah Ft | $400,000 | |
| Previous Owner | Campbell Gordon S | $50,000 |
| Date | Event | Price | List to Sale | Price per Sq Ft | Prior Sale |
|---|---|---|---|---|---|
| 11/12/2019 11/12/19 | Sold | $675,000 | -3.4% | $409 / Sq Ft | |
| 10/04/2019 10/04/19 | Pending | -- | -- | -- | |
| 09/13/2019 09/13/19 | Price Changed | $699,000 | -6.8% | $424 / Sq Ft | |
| 08/21/2019 08/21/19 | Price Changed | $749,900 | 0.0% | $454 / Sq Ft | |
| 08/08/2019 08/08/19 | Price Changed | $750,000 | -6.1% | $455 / Sq Ft | |
| 07/31/2019 07/31/19 | Price Changed | $799,000 | -4.8% | $484 / Sq Ft | |
| 07/19/2019 07/19/19 | Price Changed | $839,000 | -1.2% | $508 / Sq Ft | |
| 06/21/2019 06/21/19 | For Sale | $849,000 | +183.0% | $515 / Sq Ft | |
| 09/25/2018 09/25/18 | Sold | $300,000 | -14.0% | $184 / Sq Ft | View Prior Sale |
| 08/25/2018 08/25/18 | Pending | -- | -- | -- | |
| 08/16/2018 08/16/18 | Price Changed | $349,000 | -0.3% | $214 / Sq Ft | |
| 07/31/2018 07/31/18 | For Sale | $350,000 | 0.0% | $214 / Sq Ft | |
| 07/30/2018 07/30/18 | Pending | -- | -- | -- | |
| 07/16/2018 07/16/18 | Price Changed | $350,000 | 0.0% | $214 / Sq Ft | |
| 07/16/2018 07/16/18 | For Sale | $350,000 | +16.7% | $214 / Sq Ft | |
| 03/04/2018 03/04/18 | Off Market | $300,000 | -- | -- | |
| 02/27/2018 02/27/18 | For Sale | $649,000 | +116.3% | $398 / Sq Ft | |
| 02/24/2018 02/24/18 | Off Market | $300,000 | -- | -- | |
| 01/02/2018 01/02/18 | For Sale | $649,000 | 0.0% | $398 / Sq Ft | |
| 11/28/2017 11/28/17 | Pending | -- | -- | -- | |
| 10/31/2017 10/31/17 | Price Changed | $649,000 | -3.0% | $398 / Sq Ft | |
| 10/19/2017 10/19/17 | Price Changed | $669,000 | -0.1% | $410 / Sq Ft | |
| 10/18/2017 10/18/17 | For Sale | $669,900 | +65.4% | $410 / Sq Ft | |
| 06/16/2017 06/16/17 | Sold | $405,000 | -7.1% | $248 / Sq Ft | View Prior Sale |
| 05/23/2017 05/23/17 | Pending | -- | -- | -- | |
| 05/17/2017 05/17/17 | For Sale | $435,900 | -- | $267 / Sq Ft |
| Year | Tax Paid | Tax Assessment Tax Assessment Total Assessment is a certain percentage of the fair market value that is determined by local assessors to be the total taxable value of land and additions on the property. | Land | Improvement |
|---|---|---|---|---|
| 2025 | $10,977 | $1,108,800 | $693,000 | $415,800 |
| 2024 | $10,188 | $980,600 | $610,500 | $370,100 |
| 2023 | $9,540 | $842,800 | $528,000 | $314,800 |
| 2022 | $8,477 | $654,600 | $387,800 | $266,800 |
| 2021 | $8,410 | $637,600 | $387,800 | $249,800 |
| 2020 | $7,695 | $577,300 | $363,000 | $214,300 |
| 2019 | $7,509 | $561,200 | $363,000 | $198,200 |
| 2018 | $7,198 | $538,400 | $363,000 | $175,400 |
| 2017 | $6,990 | $509,500 | $363,000 | $146,500 |
| 2016 | $7,072 | $509,500 | $363,000 | $146,500 |
| 2015 | $7,496 | $564,000 | $429,000 | $135,000 |
| 2014 | $7,538 | $567,200 | $429,000 | $138,200 |
Seller's Agent in 2019
Michelle Burt
The Firm
(781) 910-9217
1 in this area
45 Total Sales
Buyer's Agent in 2019
The R And L Home Team
eXp Realty
(781) 343-1708
94 Total Sales
A
Seller's Agent in 2018
Amanda Crowley
Coldwell Banker Realty - Scituate
19 Total Sales
Seller's Agent in 2017
Margie McShane
Compass
(617) 592-7553
21 Total Sales
Source: MLS Property Information Network (MLS PIN)
MLS Number: 72523520
APN: MARS-000008M-000051-000013
Disclaimer: Certain information contained herein is derived from information provided by parties other than Homes.com. All information provided is deemed reliable, but is not guaranteed to be accurate and should be independently verified.
![]() The property listing data and information, or the Images, set forth herein were provided to MLS Property Information Network, Inc. from third party sources, including sellers, lessors and public records, and were compiled by MLS Property Information Network, Inc. The property listing data and information, and the Images, are for the personal, non-commercial use of consumers having a good faith interest in purchasing or leasing listed properties of the type displayed to them and may not be used for any purpose other than to identify prospective properties which such consumers may have a good faith interest in purchasing or leasing. MLS Property Information Network, Inc. and its subscribers disclaim any and all representations and warranties as to the accuracy of the property listing data and information, or as to the accuracy of any of the Images, set forth herein.
The property listing data and information, or the Images, set forth herein were provided to MLS Property Information Network, Inc. from third party sources, including sellers, lessors and public records, and were compiled by MLS Property Information Network, Inc. The property listing data and information, and the Images, are for the personal, non-commercial use of consumers having a good faith interest in purchasing or leasing listed properties of the type displayed to them and may not be used for any purpose other than to identify prospective properties which such consumers may have a good faith interest in purchasing or leasing. MLS Property Information Network, Inc. and its subscribers disclaim any and all representations and warranties as to the accuracy of the property listing data and information, or as to the accuracy of any of the Images, set forth herein.
Ask me questions while you tour the home.