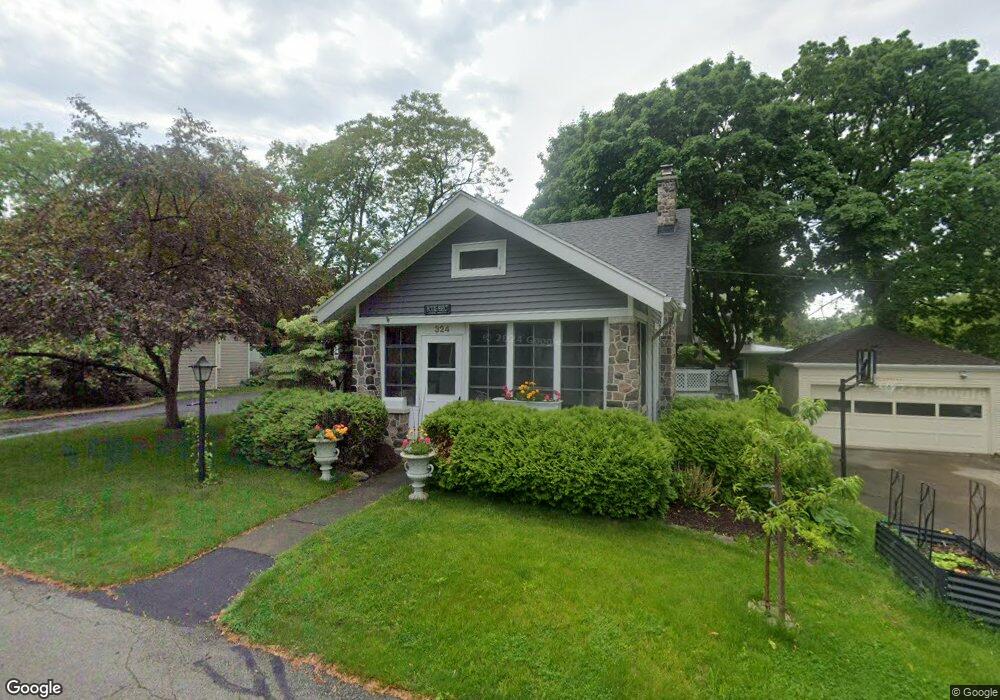
324 Peach Ave Lakeside Marblehead, OH 43440
Estimated Value: $816,000 - $1,093,000
2
Beds
2
Baths
1,582
Sq Ft
$575/Sq Ft
Est. Value
About This Home
This home is located at 324 Peach Ave, Lakeside Marblehead, OH 43440 and is currently estimated at $909,824, approximately $575 per square foot. 324 Peach Ave is a home located in Ottawa County with nearby schools including Danbury Middle School and Danbury High School.
Ownership History
Date
Name
Owned For
Owner Type
Purchase Details
Closed on
Mar 2, 2021
Sold by
Greene Matthew L and Greene Lisa T
Bought by
Greene Matthew L and Greene Lisa T
Current Estimated Value
Purchase Details
Closed on
May 15, 2020
Sold by
324 Peach Llc
Bought by
Greene Matthew L and Greene Lisa
Home Financials for this Owner
Home Financials are based on the most recent Mortgage that was taken out on this home.
Original Mortgage
$200,000
Outstanding Balance
$139,895
Interest Rate
3.3%
Mortgage Type
New Conventional
Estimated Equity
$769,929
Purchase Details
Closed on
Dec 12, 2003
Sold by
Betz Thomas E and Betz Linda L
Bought by
Collins Peter and Collins Deborah M
Purchase Details
Closed on
Oct 16, 1992
Sold by
Thornburg James and Thornburg Jean S
Bought by
Betz Thos E and Betz Linda L
Create a Home Valuation Report for This Property
The Home Valuation Report is an in-depth analysis detailing your home's value as well as a comparison with similar homes in the area
Home Values in the Area
Average Home Value in this Area
Purchase History
| Date | Buyer | Sale Price | Title Company |
|---|---|---|---|
| Greene Matthew L | -- | None Available | |
| Greene Matthew L | $500,000 | None Available | |
| Collins Peter | $280,000 | Firelands | |
| Betz Thos E | $145,900 | -- |
Source: Public Records
Mortgage History
| Date | Status | Borrower | Loan Amount |
|---|---|---|---|
| Open | Greene Matthew L | $200,000 |
Source: Public Records
Tax History Compared to Growth
Tax History
| Year | Tax Paid | Tax Assessment Tax Assessment Total Assessment is a certain percentage of the fair market value that is determined by local assessors to be the total taxable value of land and additions on the property. | Land | Improvement |
|---|---|---|---|---|
| 2024 | $8,617 | $252,826 | $122,318 | $130,508 |
| 2023 | $8,617 | $175,001 | $106,950 | $68,051 |
| 2022 | $6,042 | $175,001 | $106,950 | $68,051 |
| 2021 | $6,060 | $175,000 | $106,950 | $68,050 |
| 2020 | $4,982 | $136,150 | $68,100 | $68,050 |
| 2019 | $3,806 | $112,410 | $68,100 | $44,310 |
| 2018 | $3,968 | $112,410 | $68,100 | $44,310 |
| 2017 | $3,599 | $100,470 | $63,330 | $37,140 |
| 2016 | $3,564 | $100,470 | $63,330 | $37,140 |
| 2015 | $3,580 | $100,470 | $63,330 | $37,140 |
| 2014 | $1,913 | $105,240 | $68,100 | $37,140 |
| 2013 | $3,563 | $105,240 | $68,100 | $37,140 |
Source: Public Records
Map
Nearby Homes