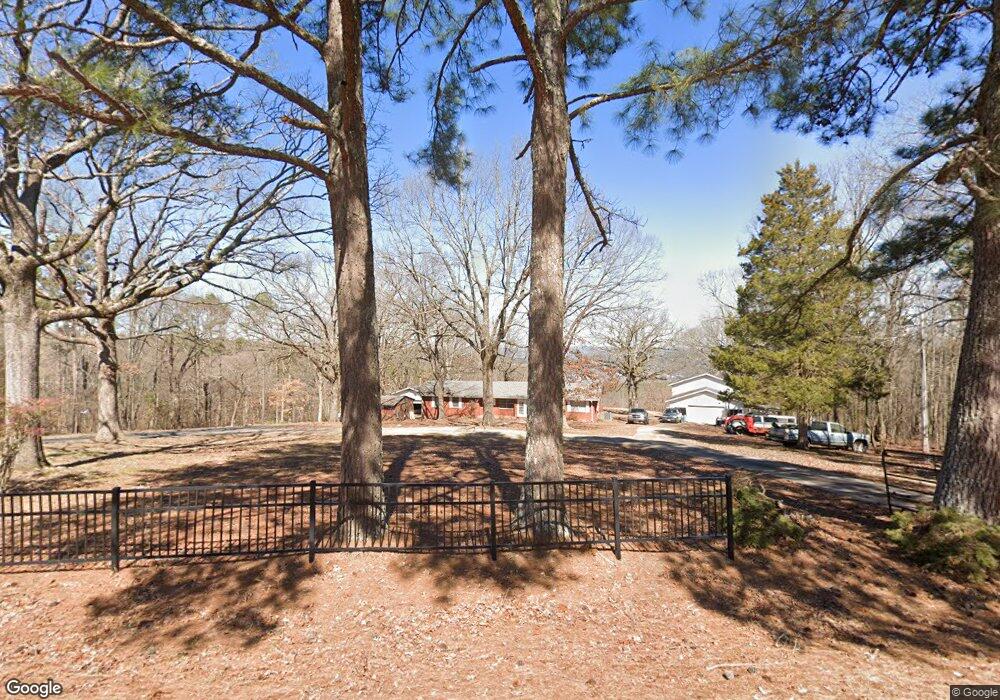
324 Ridgecrest Rd Unit 2300 HWY 25 B North Heber Springs, AR 72543
Estimated Value: $280,136 - $308,000
4
Beds
3
Baths
1,960
Sq Ft
$151/Sq Ft
Est. Value
About This Home
This home is located at 324 Ridgecrest Rd Unit 2300 HWY 25 B North, Heber Springs, AR 72543 and is currently estimated at $296,284, approximately $151 per square foot. 324 Ridgecrest Rd Unit 2300 HWY 25 B North is a home located in Cleburne County with nearby schools including Heber Springs Elementary School, Heber Springs Middle School, and Heber Springs High School.
Ownership History
Date
Name
Owned For
Owner Type
Purchase Details
Closed on
Nov 4, 2022
Sold by
Johnson John A
Bought by
Maynrad Karyn M and Maynrad James
Current Estimated Value
Home Financials for this Owner
Home Financials are based on the most recent Mortgage that was taken out on this home.
Original Mortgage
$55,000
Outstanding Balance
$53,335
Interest Rate
7.08%
Mortgage Type
New Conventional
Estimated Equity
$242,949
Purchase Details
Closed on
Jul 25, 2018
Sold by
Johnson John A
Bought by
Bunch Terren and Defoor Smantha
Home Financials for this Owner
Home Financials are based on the most recent Mortgage that was taken out on this home.
Original Mortgage
$150,000
Interest Rate
4.6%
Mortgage Type
Seller Take Back
Purchase Details
Closed on
Jan 1, 1982
Bought by
Johnson John H
Create a Home Valuation Report for This Property
The Home Valuation Report is an in-depth analysis detailing your home's value as well as a comparison with similar homes in the area
Home Values in the Area
Average Home Value in this Area
Purchase History
| Date | Buyer | Sale Price | Title Company |
|---|---|---|---|
| Maynrad Karyn M | -- | None Listed On Document | |
| Bunch Terren | $150,000 | None Available | |
| Johnson John H | -- | -- |
Source: Public Records
Mortgage History
| Date | Status | Borrower | Loan Amount |
|---|---|---|---|
| Open | Maynrad Karyn M | $55,000 | |
| Previous Owner | Bunch Terren | $150,000 |
Source: Public Records
Tax History Compared to Growth
Tax History
| Year | Tax Paid | Tax Assessment Tax Assessment Total Assessment is a certain percentage of the fair market value that is determined by local assessors to be the total taxable value of land and additions on the property. | Land | Improvement |
|---|---|---|---|---|
| 2024 | $1,506 | $39,732 | $5,000 | $34,732 |
| 2023 | $1,473 | $40,286 | $5,000 | $35,286 |
| 2022 | $1,400 | $40,286 | $5,000 | $35,286 |
| 2021 | $1,277 | $32,381 | $4,000 | $28,381 |
| 2020 | $1,277 | $32,381 | $4,000 | $28,381 |
| 2019 | $1,277 | $32,381 | $4,000 | $28,381 |
| 2018 | $1,277 | $32,381 | $4,000 | $28,381 |
| 2017 | $653 | $32,381 | $4,000 | $28,381 |
| 2016 | $653 | $25,140 | $4,000 | $21,140 |
| 2015 | $603 | $25,140 | $4,000 | $21,140 |
| 2014 | $603 | $25,140 | $4,000 | $21,140 |
Source: Public Records
Map
Nearby Homes
- 264 Zebulin Dr
- 99 Country Aire Dr
- 243 Heber Springs Rd W
- 79 Plantation Dr E
- 1417 Meadowbrook Dr
- 1325 Meadowbrook Dr
- 1209 Meadowbrook Ln
- 000 S Hwy 25
- 909 South St
- 1101 S 8th St
- 00000 Deer Run Cove
- 0000 Deer Run Cove
- 000 Cross St
- 725 Spruce St
- 0 Spruce Unit 25003165
- 2125 Snooze Dr
- 616 Cedar Dr
- 609 Scenic Valley Dr
- 824 Fox Run Rd
- 400 Plantation Dr E
- 324 Ridgecrest Rd
- 284 Ridgecrest Rd
- 321 Ridgecrest Rd
- 334 Ridgecrest Rd
- 374 Ridgecrest Rd
- 255 Ridgecrest Rd
- 229 Ridgecrest Rd
- 0 Ridgecrest Dr
- 219 Ridgecrest Rd
- 260 Ridgecrest Rd
- 384 Ridgecrest Rd
- 40 Ridgecrest Dr
- 40 Ridgecrest Dr
- 205 Ridgecrest Rd
- 379 Ridgecrest Rd
- 254 Ridgecrest Rd
- 234 Ridgecrest Rd
- 175 Ridgecrest Rd
- 250 Ridgecrest Rd
- 224 Ridgecrest Rd