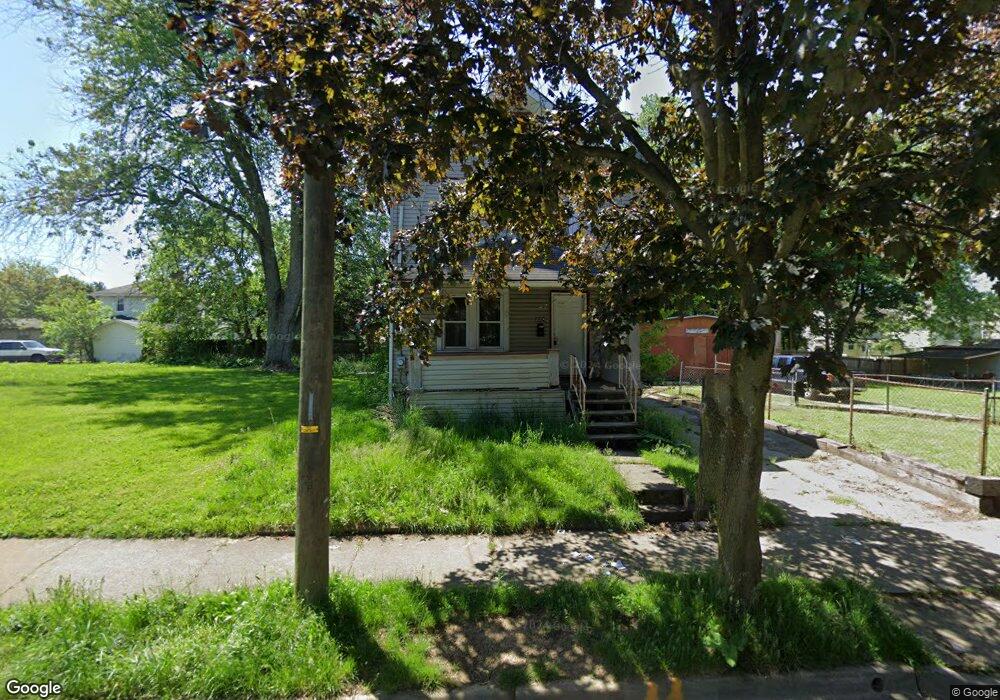
324 Upland Ave Akron, OH 44301
South Akron NeighborhoodEstimated Value: $77,000 - $140,000
3
Beds
2
Baths
1,104
Sq Ft
$91/Sq Ft
Est. Value
About This Home
This home is located at 324 Upland Ave, Akron, OH 44301 and is currently estimated at $100,396, approximately $90 per square foot. 324 Upland Ave is a home located in Summit County with nearby schools including McEbright Elementary School, Kenmore Garfield Community Learning Center, and Main Preparatory Academy.
Ownership History
Date
Name
Owned For
Owner Type
Purchase Details
Closed on
Mar 2, 2009
Sold by
Jaber Baglia Sana
Bought by
Genovese Brad R
Current Estimated Value
Home Financials for this Owner
Home Financials are based on the most recent Mortgage that was taken out on this home.
Original Mortgage
$49,600
Outstanding Balance
$31,169
Interest Rate
4.91%
Mortgage Type
Purchase Money Mortgage
Estimated Equity
$69,227
Purchase Details
Closed on
Jul 31, 2008
Sold by
Fannie Mae
Bought by
Jaber Baglia Sana
Purchase Details
Closed on
May 13, 2008
Sold by
Eckley Mark S
Bought by
Federal National Mortgage Association
Purchase Details
Closed on
Oct 13, 2004
Sold by
Fleetwood Properties Llc
Bought by
Eckley Mark S and Eckley Cheryl L
Home Financials for this Owner
Home Financials are based on the most recent Mortgage that was taken out on this home.
Original Mortgage
$61,750
Interest Rate
7.74%
Mortgage Type
Purchase Money Mortgage
Purchase Details
Closed on
Jun 24, 2004
Sold by
Fannie Mae
Bought by
Fleetwood Properties
Purchase Details
Closed on
Nov 10, 2003
Sold by
Truman Rodrick
Bought by
Federal National Mortgage Association
Purchase Details
Closed on
May 4, 2001
Sold by
Residential Rehab Group Inc
Bought by
Truman Rodrick and Truman Barbara
Home Financials for this Owner
Home Financials are based on the most recent Mortgage that was taken out on this home.
Original Mortgage
$62,100
Interest Rate
6.95%
Purchase Details
Closed on
Apr 6, 2001
Sold by
Residential Rehab Group
Bought by
Truman Rodrick
Home Financials for this Owner
Home Financials are based on the most recent Mortgage that was taken out on this home.
Original Mortgage
$62,100
Interest Rate
6.95%
Purchase Details
Closed on
Jan 11, 2001
Sold by
United Companies Lending Corp
Bought by
Residential Rehab Group Inc
Purchase Details
Closed on
Nov 15, 2000
Sold by
Benson Britt R
Bought by
United Companies Lending Corp
Create a Home Valuation Report for This Property
The Home Valuation Report is an in-depth analysis detailing your home's value as well as a comparison with similar homes in the area
Home Values in the Area
Average Home Value in this Area
Purchase History
| Date | Buyer | Sale Price | Title Company |
|---|---|---|---|
| Genovese Brad R | $62,000 | Clear Title Solutions Inc | |
| Jaber Baglia Sana | $3,750 | Title First Agency | |
| Federal National Mortgage Association | $38,000 | None Available | |
| Eckley Mark S | $65,000 | Wigley Title Agency Inc | |
| Fleetwood Properties | $28,000 | Beacon Title Agency Inc | |
| Federal National Mortgage Association | $38,000 | -- | |
| Truman Rodrick | $58,100 | Cresent Title Agency | |
| Truman Rodrick | $58,100 | -- | |
| Residential Rehab Group Inc | $21,000 | -- | |
| United Companies Lending Corp | $30,000 | -- |
Source: Public Records
Mortgage History
| Date | Status | Borrower | Loan Amount |
|---|---|---|---|
| Open | Genovese Brad R | $49,600 | |
| Previous Owner | Eckley Mark S | $61,750 | |
| Previous Owner | Truman Rodrick | $62,100 | |
| Previous Owner | Truman Rodrick | $58,100 |
Source: Public Records
Tax History Compared to Growth
Tax History
| Year | Tax Paid | Tax Assessment Tax Assessment Total Assessment is a certain percentage of the fair market value that is determined by local assessors to be the total taxable value of land and additions on the property. | Land | Improvement |
|---|---|---|---|---|
| 2025 | $1,022 | $18,180 | $3,532 | $14,648 |
| 2024 | $1,022 | $18,180 | $3,532 | $14,648 |
| 2023 | $1,022 | $18,180 | $3,532 | $14,648 |
| 2022 | $954 | $11,729 | $2,279 | $9,450 |
| 2021 | $851 | $11,729 | $2,279 | $9,450 |
| 2020 | $839 | $11,730 | $2,280 | $9,450 |
| 2019 | $1,108 | $14,360 | $3,440 | $10,920 |
| 2018 | $1,094 | $14,360 | $3,440 | $10,920 |
| 2017 | $1,130 | $14,360 | $3,440 | $10,920 |
| 2016 | $1,131 | $14,620 | $3,440 | $11,180 |
| 2015 | $1,130 | $14,620 | $3,440 | $11,180 |
| 2014 | $1,121 | $14,620 | $3,440 | $11,180 |
| 2013 | $1,155 | $15,860 | $3,440 | $12,420 |
Source: Public Records
Map
Nearby Homes