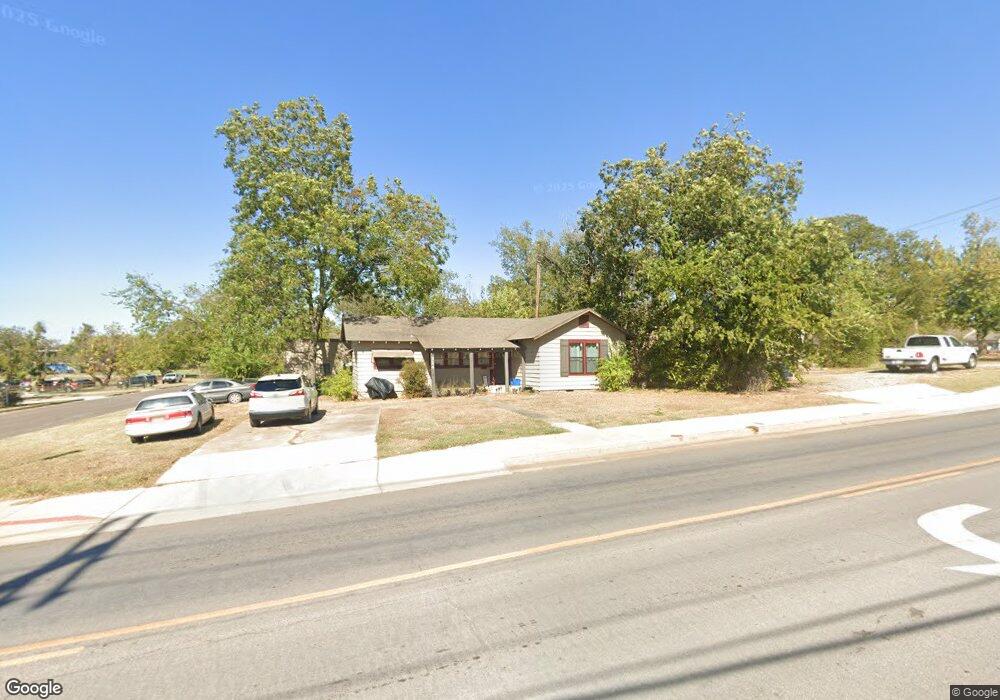
324 W Independence St Shawnee, OK 74804
Estimated Value: $87,000 - $111,000
3
Beds
1
Bath
906
Sq Ft
$107/Sq Ft
Est. Value
About This Home
This home is located at 324 W Independence St, Shawnee, OK 74804 and is currently estimated at $97,363, approximately $107 per square foot. 324 W Independence St is a home located in Pottawatomie County with nearby schools including Sequoyah Elementary School, Shawnee Middle School, and Shawnee High School.
Ownership History
Date
Name
Owned For
Owner Type
Purchase Details
Closed on
Jul 16, 2018
Sold by
Smith Merrill D and Smith Kerri
Bought by
Smith Stephanie D
Current Estimated Value
Home Financials for this Owner
Home Financials are based on the most recent Mortgage that was taken out on this home.
Original Mortgage
$58,200
Outstanding Balance
$50,439
Interest Rate
4.5%
Mortgage Type
New Conventional
Estimated Equity
$46,924
Purchase Details
Closed on
Jan 13, 2009
Sold by
Lipe Mickey
Bought by
Smith Merrill D
Home Financials for this Owner
Home Financials are based on the most recent Mortgage that was taken out on this home.
Original Mortgage
$24,000
Interest Rate
7%
Mortgage Type
Seller Take Back
Purchase Details
Closed on
Jul 5, 2000
Sold by
Ray Ben and Ray Jean
Bought by
Lipe Mickey and Lipe Jacqueline
Create a Home Valuation Report for This Property
The Home Valuation Report is an in-depth analysis detailing your home's value as well as a comparison with similar homes in the area
Home Values in the Area
Average Home Value in this Area
Purchase History
| Date | Buyer | Sale Price | Title Company |
|---|---|---|---|
| Smith Stephanie D | $60,000 | Choice Title Insurance | |
| Smith Merrill D | $24,000 | None Available | |
| Lipe Mickey | $11,000 | -- |
Source: Public Records
Mortgage History
| Date | Status | Borrower | Loan Amount |
|---|---|---|---|
| Open | Smith Stephanie D | $58,200 | |
| Previous Owner | Smith Merrill D | $24,000 |
Source: Public Records
Tax History Compared to Growth
Tax History
| Year | Tax Paid | Tax Assessment Tax Assessment Total Assessment is a certain percentage of the fair market value that is determined by local assessors to be the total taxable value of land and additions on the property. | Land | Improvement |
|---|---|---|---|---|
| 2024 | $711 | $7,149 | $624 | $6,525 |
| 2023 | $711 | $6,809 | $624 | $6,185 |
| 2022 | $699 | $6,809 | $624 | $6,185 |
| 2021 | $686 | $6,809 | $624 | $6,185 |
| 2020 | $710 | $7,027 | $624 | $6,403 |
| 2019 | $750 | $7,181 | $624 | $6,557 |
| 2018 | $368 | $3,592 | $623 | $2,969 |
| 2017 | $345 | $3,421 | $595 | $2,826 |
| 2016 | $332 | $3,258 | $790 | $2,468 |
| 2015 | $310 | $3,103 | $753 | $2,350 |
| 2014 | $296 | $2,955 | $505 | $2,450 |
Source: Public Records
Map
Nearby Homes
- 1324 N Park Ave
- 1217 N Market Ave
- 1607 N Beard Ave
- 1710 N Park Ave
- 1006 N Market Ave
- 1834 N Market Ave
- 1510 N Union Ave
- 1012 N Chapman Ave
- 1816 N Bell Ave
- 1017 N Bdwy Ave
- 920 N Kickapoo Ave
- 1817 N Bell Ave
- 1925 N Park Ave
- 320 W Dill St
- 318 W Dill St
- 317 W Dill St
- 210 E Cammack
- 1901 N Bell Ave
- 1822 N Philadelphia Ave
- 810 N Kickapoo Ave
- 318 W Independence St
- 1505 N Louisa Ave
- 402 W Independence St
- 1509 N Louisa Ave
- 315 W Independence St
- 1511 N Louisa Ave
- 406 W Independence St
- 1502 N Park Ave
- 1508 N Louisa Ave
- 1506 N Louisa Ave
- 1426 N Louisa Ave
- 1418 N Louisa Ave
- 1513 N Louisa Ave
- 1504 N Park Ave
- 1432 N Park Ave
- 1510 N Park Ave
- 1416 N Louisa Ave
- 1417 N Louisa Ave
- 1515 N Louisa Ave
- 1430 N Park Ave