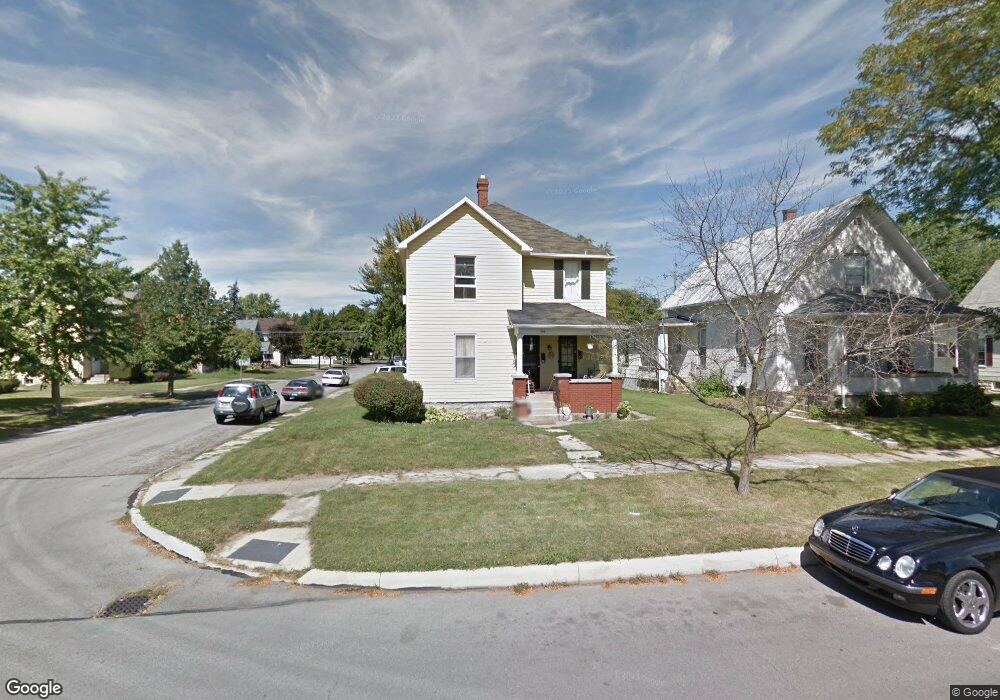
324 W Lima St Findlay, OH 45840
Estimated Value: $151,000 - $165,000
2
Beds
2
Baths
1,250
Sq Ft
$126/Sq Ft
Est. Value
About This Home
This home is located at 324 W Lima St, Findlay, OH 45840 and is currently estimated at $157,676, approximately $126 per square foot. 324 W Lima St is a home located in Hancock County with nearby schools including Lincoln Elementary School, Donnell Middle School, and Findlay High School.
Ownership History
Date
Name
Owned For
Owner Type
Purchase Details
Closed on
Aug 5, 2020
Sold by
Flk Housing Llc
Bought by
Slof Housing Llc
Current Estimated Value
Home Financials for this Owner
Home Financials are based on the most recent Mortgage that was taken out on this home.
Original Mortgage
$101,600
Outstanding Balance
$90,126
Interest Rate
3%
Mortgage Type
Credit Line Revolving
Estimated Equity
$67,550
Purchase Details
Closed on
May 16, 2019
Sold by
Etzler Andrew D
Bought by
Flk Housing Llc
Home Financials for this Owner
Home Financials are based on the most recent Mortgage that was taken out on this home.
Original Mortgage
$100,000
Interest Rate
4.1%
Mortgage Type
Commercial
Purchase Details
Closed on
Jun 5, 2017
Sold by
Cramer Nancy K
Bought by
Etzler Andrew D
Purchase Details
Closed on
Sep 13, 2004
Sold by
Cramer Dennis F and Cramer Nancy
Bought by
Cramer Nancy K
Purchase Details
Closed on
Dec 13, 1985
Bought by
Cramer Dennis F and Cramer Nancy
Create a Home Valuation Report for This Property
The Home Valuation Report is an in-depth analysis detailing your home's value as well as a comparison with similar homes in the area
Home Values in the Area
Average Home Value in this Area
Purchase History
| Date | Buyer | Sale Price | Title Company |
|---|---|---|---|
| Slof Housing Llc | -- | None Available | |
| Flk Housing Llc | $125,000 | Flag City Title Agency Inc | |
| Etzler Andrew D | $45,000 | Mid Am Title Agecny | |
| Cramer Nancy K | -- | -- | |
| Cramer Dennis F | $48,000 | -- |
Source: Public Records
Mortgage History
| Date | Status | Borrower | Loan Amount |
|---|---|---|---|
| Open | Slof Housing Llc | $101,600 | |
| Previous Owner | Flk Housing Llc | $100,000 |
Source: Public Records
Property History
| Date | Event | Price | List to Sale | Price per Sq Ft |
|---|---|---|---|---|
| 10/08/2024 10/08/24 | Off Market | $975 | -- | -- |
| 03/20/2023 03/20/23 | For Rent | $975 | -- | -- |
Tax History Compared to Growth
Tax History
| Year | Tax Paid | Tax Assessment Tax Assessment Total Assessment is a certain percentage of the fair market value that is determined by local assessors to be the total taxable value of land and additions on the property. | Land | Improvement |
|---|---|---|---|---|
| 2024 | $1,422 | $39,010 | $4,720 | $34,290 |
| 2023 | $1,424 | $39,010 | $4,720 | $34,290 |
| 2022 | $1,419 | $39,010 | $4,720 | $34,290 |
| 2021 | $1,444 | $34,580 | $4,830 | $29,750 |
| 2020 | $1,444 | $34,580 | $4,830 | $29,750 |
| 2019 | $1,416 | $34,580 | $4,830 | $29,750 |
| 2018 | $1,244 | $27,870 | $3,860 | $24,010 |
| 2017 | $1,244 | $27,870 | $3,860 | $24,010 |
| 2016 | $1,236 | $27,870 | $3,860 | $24,010 |
| 2015 | $943 | $20,960 | $3,700 | $17,260 |
| 2014 | $943 | $20,960 | $3,700 | $17,260 |
| 2012 | $848 | $18,690 | $3,700 | $14,990 |
Source: Public Records
Map
Nearby Homes
- 720 S West St
- 225 Lima Ave
- 905 S West St
- 419 W Lincoln St
- 412 Lima Ave
- 416 1/2 Lima Ave
- 527 W Lincoln St
- 514 Liberty St
- 1115 Liberty St
- 202 Hancock St
- 829 Maple Ave
- 801 W Sandusky St
- 420 1st St
- 123 Glendale Ave
- 817 Park St
- 407 Washington St
- 1421 Hurd Ave
- 210 Western Ave
- 1109 Park St
- 915 W Main Cross St
- 324 W Lima St Unit Upper
- 320 W Lima St
- 314 W Lima St
- 730 Liberty St
- 717 Liberty St
- 717 Liberty St Unit 719 (Back)
- 310 W Lima St
- 718 Liberty St
- 317 W Lima St
- 401 W Lima St
- 726 Liberty St
- 722 Liberty St
- 416 W Lima St
- 306 W Lima St
- 715 Liberty St
- 405 W Lima St
- 315 W Lima St
- 418 W Lima St
- 311 W Lima St
- 302 W Lima St