Estimated Value: $232,000 - $243,000
3
Beds
2
Baths
1,468
Sq Ft
$161/Sq Ft
Est. Value
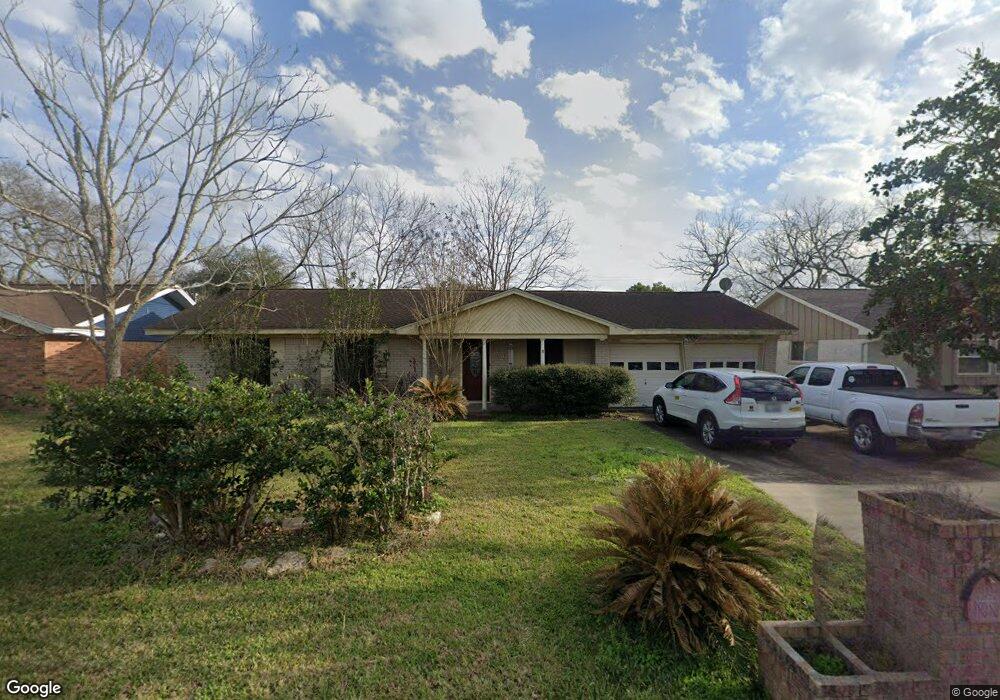
About This Home
This home is located at 324 Windsor Square, Alvin, TX 77511 and is currently estimated at $235,678, approximately $160 per square foot. 324 Windsor Square is a home located in Brazoria County with nearby schools including R.L. Stevenson Primary School, Alvin Junior High School, and Alvin High School.
Ownership History
Date
Name
Owned For
Owner Type
Purchase Details
Closed on
Jul 29, 2010
Sold by
Cooper Mery Elizabeth
Bought by
Cooper Michael Dean
Current Estimated Value
Purchase Details
Closed on
Aug 9, 2000
Sold by
Szeklinski Deel C and Szeklinski E
Bought by
Cooper Michael D and Cooper Mery E
Home Financials for this Owner
Home Financials are based on the most recent Mortgage that was taken out on this home.
Original Mortgage
$77,425
Outstanding Balance
$28,054
Interest Rate
8.21%
Estimated Equity
$207,624
Purchase Details
Closed on
Jul 28, 1995
Sold by
Moore Ralph H and Moore Jewell B
Bought by
Szeklinski Deel C and Szeklinski E
Home Financials for this Owner
Home Financials are based on the most recent Mortgage that was taken out on this home.
Original Mortgage
$64,600
Interest Rate
7.49%
Create a Home Valuation Report for This Property
The Home Valuation Report is an in-depth analysis detailing your home's value as well as a comparison with similar homes in the area
Home Values in the Area
Average Home Value in this Area
Purchase History
| Date | Buyer | Sale Price | Title Company |
|---|---|---|---|
| Cooper Michael Dean | -- | None Available | |
| Cooper Michael D | -- | Alamo Title 4 | |
| Szeklinski Deel C | -- | -- |
Source: Public Records
Mortgage History
| Date | Status | Borrower | Loan Amount |
|---|---|---|---|
| Open | Cooper Michael D | $77,425 | |
| Previous Owner | Szeklinski Deel C | $64,600 | |
| Closed | Cooper Michael Dean | $0 |
Source: Public Records
Tax History
| Year | Tax Paid | Tax Assessment Tax Assessment Total Assessment is a certain percentage of the fair market value that is determined by local assessors to be the total taxable value of land and additions on the property. | Land | Improvement |
|---|---|---|---|---|
| 2025 | $4,110 | $233,840 | $44,600 | $189,240 |
| 2024 | $4,110 | $236,102 | $44,600 | $196,210 |
| 2023 | $4,110 | $214,638 | $44,600 | $194,920 |
| 2022 | $5,352 | $195,125 | $27,870 | $167,580 |
| 2021 | $5,121 | $180,900 | $32,110 | $148,790 |
| 2020 | $4,720 | $161,530 | $26,760 | $134,770 |
| 2019 | $4,403 | $146,600 | $22,300 | $124,300 |
| 2018 | $4,257 | $141,480 | $22,300 | $119,180 |
| 2017 | $4,046 | $136,570 | $22,300 | $114,270 |
| 2016 | $3,678 | $134,490 | $18,580 | $115,910 |
| 2014 | $2,975 | $108,490 | $18,580 | $89,910 |
Source: Public Records
Map
Nearby Homes
- 355 Windsor Square
- 336 Paso Fino Dr
- 3111 Paso Fino Dr
- 300 Mustang Rd
- 1145 Westglen Dr
- 3820 Clover Dr
- 111 Fairway Dr
- 2708 Tallow St
- 2701 Mustang Rd
- 735 Sandpit Rd Unit 812
- 201 W Timberlane Dr
- SH 35 Texas 35
- 3311 County Road 890
- 211 Fitz Rd
- 101 W Larkspur Dr
- 2315 Mustang Rd Unit 26
- 205 Hillcrest Dr
- 204 Hillcrest Dr
- 610 Linda Ln
- 215 Ridgemont Dr
- 322 Windsor Square
- 326 Windsor Square
- 325 Hurstgreen Ln
- 327 Hurstgreen Ln
- 323 Hurstgreen Ln
- 328 Windsor Square
- 320 Windsor Square
- 329 Hurstgreen Ln
- 321 Hurstgreen Ln
- 325 Windsor Square
- 323 Windsor Square
- 330 Windsor Square
- 318 Windsor Square
- 321 Windsor Square
- 327 Windsor Square
- 331 Hurstgreen Ln
- 319 Hurstgreen Ln
- 332 Windsor Square
- 316 Windsor Square
- 319 Windsor Square
Your Personal Tour Guide
Ask me questions while you tour the home.