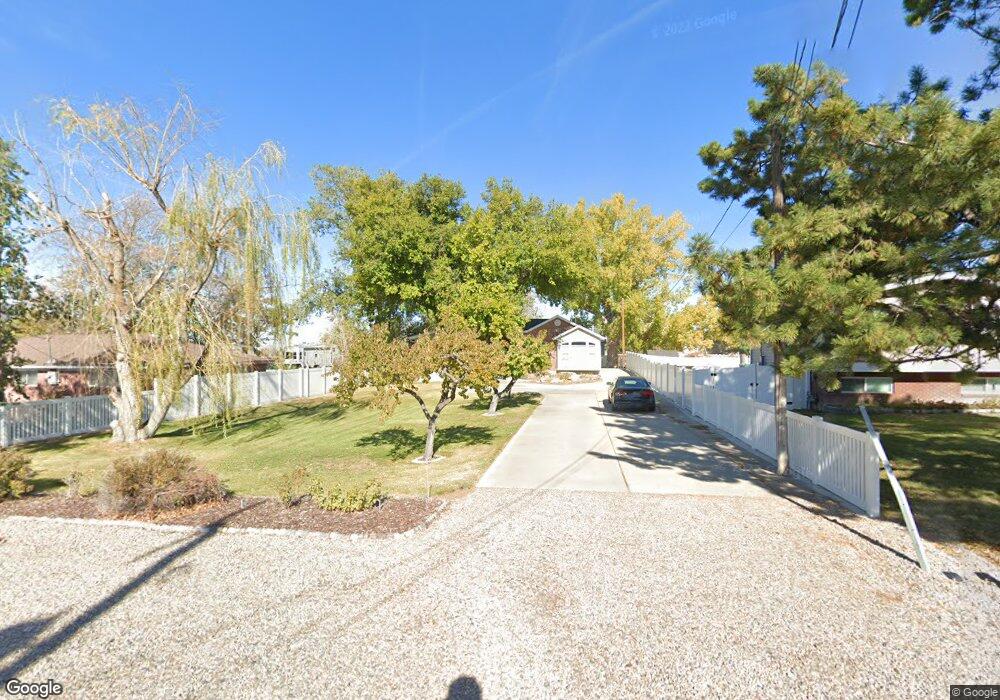
3240 W 800 N Clearfield, UT 84015
Estimated Value: $494,000 - $627,000
--
Bed
3
Baths
2,024
Sq Ft
$272/Sq Ft
Est. Value
About This Home
This home is located at 3240 W 800 N, Clearfield, UT 84015 and is currently estimated at $550,853, approximately $272 per square foot. 3240 W 800 N is a home located in Davis County with nearby schools including Lakeside School, West Point Junior High School, and Syracuse High School.
Ownership History
Date
Name
Owned For
Owner Type
Purchase Details
Closed on
Jun 6, 2019
Sold by
Parker Misti and Parker Dale L
Bought by
Parker Dale L and Parker Misti T
Current Estimated Value
Purchase Details
Closed on
Dec 7, 2011
Sold by
Parker Misti T and Parker Dale L
Bought by
Parker Misti and Parker Dale L
Home Financials for this Owner
Home Financials are based on the most recent Mortgage that was taken out on this home.
Original Mortgage
$164,480
Outstanding Balance
$15,967
Interest Rate
3.36%
Mortgage Type
New Conventional
Estimated Equity
$534,886
Purchase Details
Closed on
Jun 15, 2009
Sold by
Parker Dale L and Parker Misti T
Bought by
Parker Misti T and Parker Dale L
Home Financials for this Owner
Home Financials are based on the most recent Mortgage that was taken out on this home.
Original Mortgage
$175,200
Interest Rate
4.82%
Mortgage Type
New Conventional
Purchase Details
Closed on
Apr 19, 2002
Sold by
Mark Higley Construction Lc
Bought by
America West Development Lc
Create a Home Valuation Report for This Property
The Home Valuation Report is an in-depth analysis detailing your home's value as well as a comparison with similar homes in the area
Home Values in the Area
Average Home Value in this Area
Purchase History
| Date | Buyer | Sale Price | Title Company |
|---|---|---|---|
| Parker Dale L | -- | None Available | |
| Parker Misti | -- | Bonnieville Superior | |
| Parker Misti T | -- | Inwest Title Service | |
| America West Development Lc | -- | Bonneville Title Company Inc |
Source: Public Records
Mortgage History
| Date | Status | Borrower | Loan Amount |
|---|---|---|---|
| Open | Parker Misti | $164,480 | |
| Closed | Parker Misti T | $175,200 |
Source: Public Records
Tax History Compared to Growth
Tax History
| Year | Tax Paid | Tax Assessment Tax Assessment Total Assessment is a certain percentage of the fair market value that is determined by local assessors to be the total taxable value of land and additions on the property. | Land | Improvement |
|---|---|---|---|---|
| 2025 | $3,169 | $297,000 | $121,895 | $175,105 |
| 2024 | $2,951 | $277,750 | $109,693 | $168,057 |
| 2023 | $2,755 | $477,000 | $139,635 | $337,365 |
| 2022 | $2,954 | $279,950 | $73,457 | $206,493 |
| 2021 | $2,638 | $374,000 | $111,609 | $262,391 |
| 2020 | $2,337 | $327,000 | $94,332 | $232,668 |
| 2019 | $2,283 | $315,000 | $91,350 | $223,650 |
| 2018 | $2,081 | $283,000 | $90,106 | $192,894 |
| 2016 | $1,769 | $126,555 | $34,918 | $91,637 |
| 2015 | $1,767 | $119,790 | $34,918 | $84,872 |
| 2014 | $1,866 | $128,298 | $34,918 | $93,380 |
| 2013 | -- | $96,055 | $30,836 | $65,219 |
Source: Public Records
Map
Nearby Homes
- 3212 W 600 N
- 3187 W 525 N
- 488 N 3100 W
- 1172 N 3000 W
- 2816 W 960 N
- 399 N 3425 W
- 3168 W 1300 N
- 2959 W 1300 N
- 2921 W 1300 N
- 878 N 2600 W
- 3918 W 825 N Unit WF6
- 3932 W 825 N Unit WF5
- 2535 W 550 N
- Charleston Plan at Bluff View
- 1251 N 2525 W
- 2633 N 2080 W Unit 180
- 2623 N 2080 W Unit 178
- 380 S 4300 W Unit 608
- 997 N 5100 W Unit 213
- 2619 N 2080 W Unit 177