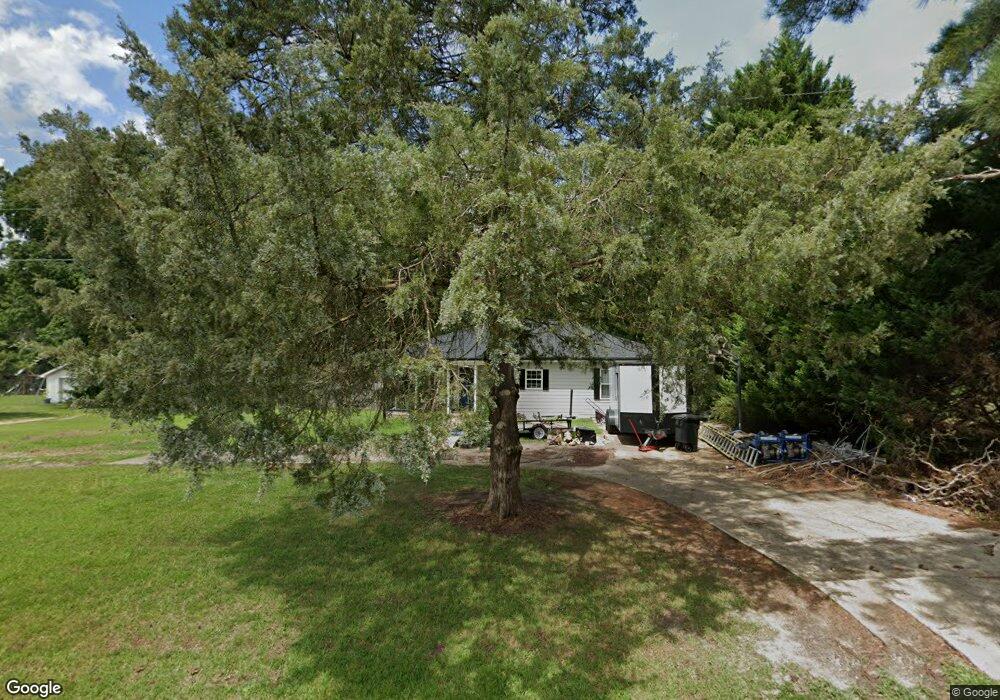
3241 Quarry Rd Wake Forest, NC 27587
Estimated Value: $276,364 - $312,000
3
Beds
2
Baths
1,313
Sq Ft
$221/Sq Ft
Est. Value
About This Home
This home is located at 3241 Quarry Rd, Wake Forest, NC 27587 and is currently estimated at $290,591, approximately $221 per square foot. 3241 Quarry Rd is a home located in Wake County with nearby schools including Rolesville Elementary School, Rolesville Middle School, and Rolesville High School.
Ownership History
Date
Name
Owned For
Owner Type
Purchase Details
Closed on
Oct 23, 2020
Sold by
Tma Enterprise Llc
Bought by
Cheek Mitchell C
Current Estimated Value
Home Financials for this Owner
Home Financials are based on the most recent Mortgage that was taken out on this home.
Original Mortgage
$227,272
Outstanding Balance
$201,778
Interest Rate
2.8%
Mortgage Type
New Conventional
Estimated Equity
$88,813
Purchase Details
Closed on
Jan 2, 2020
Sold by
Haley Kelly A and Stallings Kelly A Haley
Bought by
Tma Enterprise Llc
Purchase Details
Closed on
Oct 26, 2001
Sold by
Hailey Leola M and Hailey Levi Willard
Bought by
Haley Marshall G and Haley Martin G
Purchase Details
Closed on
Jul 13, 1999
Sold by
Haley Willard and Haley Leola S
Bought by
Stallings Kelly A Haley
Create a Home Valuation Report for This Property
The Home Valuation Report is an in-depth analysis detailing your home's value as well as a comparison with similar homes in the area
Home Values in the Area
Average Home Value in this Area
Purchase History
| Date | Buyer | Sale Price | Title Company |
|---|---|---|---|
| Cheek Mitchell C | $225,000 | None Available | |
| Tma Enterprise Llc | $85,000 | None Available | |
| Tma Enterprise Llc | $85,000 | None Listed On Document | |
| Haley Marshall G | $12,000 | -- | |
| Stallings Kelly A Haley | -- | -- |
Source: Public Records
Mortgage History
| Date | Status | Borrower | Loan Amount |
|---|---|---|---|
| Open | Cheek Mitchell C | $227,272 |
Source: Public Records
Tax History
| Year | Tax Paid | Tax Assessment Tax Assessment Total Assessment is a certain percentage of the fair market value that is determined by local assessors to be the total taxable value of land and additions on the property. | Land | Improvement |
|---|---|---|---|---|
| 2025 | $1,459 | $225,044 | $30,000 | $195,044 |
| 2024 | $1,418 | $225,044 | $30,000 | $195,044 |
Source: Public Records
Map
Nearby Homes
- 433 Contempo Ct Unit 3
- 433 Contempo Dr
- 1511 Mirth Ct
- 1610 Mirth Ct
- 1621 Mirth Ct
- 1623 Mirth Ct
- 1600 Mirth Ct
- 1617 Mirth Ct
- 1524 Mirth Ct
- 2832 Quarry Rd Unit 176
- 2836 Quarry Rd Unit 175
- 317 Marvel Dr Unit 149
- 1615 Mirth Ct
- 305 Marvel Dr Unit 146
- 2896 Quarry Rd Unit 158
- 2892 Quarry Rd Unit 159
- 2892 Quarry Rd
- 721 Compeer Way Unit 35
- 721 Compeer Way
- 2888 Quarry Rd Unit 160
- 3229 Quarry Rd
- 3229 Quarry Rd
- 3305 Quarry Rd
- 3228 Quarry Rd
- 3300 Quarry Rd
- 3225 Quarry Rd
- 3224 Quarry Rd
- 4808 Scarborough Oak Trail
- 4808 Scarborough Oak Trail Unit None
- 3221 Quarry Rd
- 3315 Quarry Rd
- 3220 Quarry Rd
- 3304 Quarry Rd
- 3317 Quarry Rd
- 3217 Quarry Rd
- 4832 Scarborough Oak Trail
- 3325 Quarry Rd
- 3309 Quarry Rd
- 3216 Quarry Rd
- 3327 Quarry Rd
Your Personal Tour Guide
Ask me questions while you tour the home.