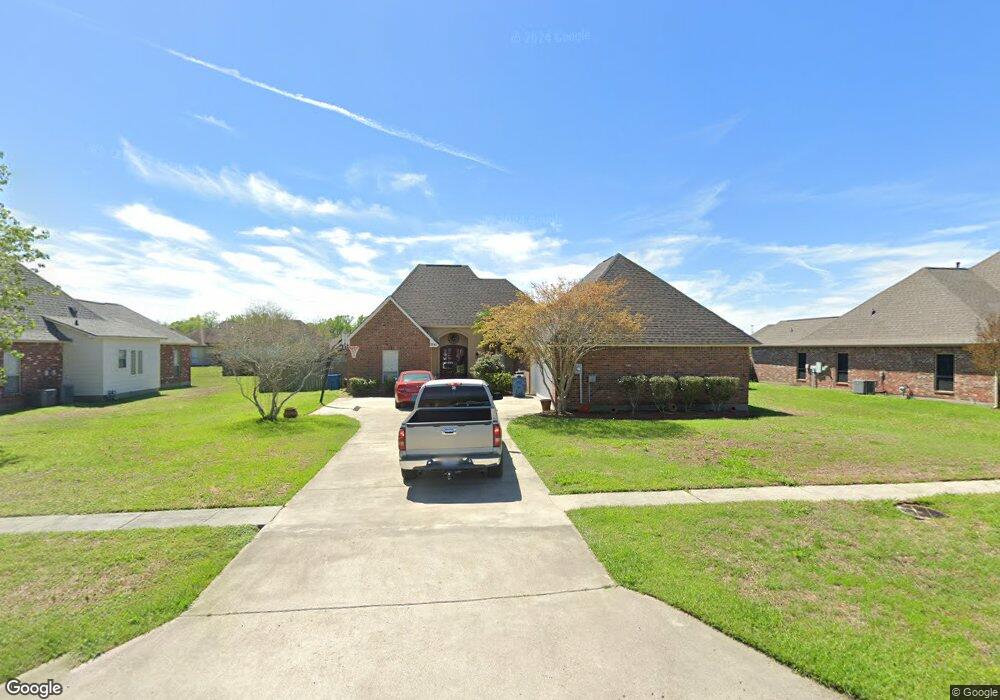
3241 River Landing Dr Addis, LA 70710
West Baton Rouge Parish NeighborhoodEstimated Value: $297,000 - $319,000
4
Beds
3
Baths
1,862
Sq Ft
$163/Sq Ft
Est. Value
About This Home
This home is located at 3241 River Landing Dr, Addis, LA 70710 and is currently estimated at $303,638, approximately $163 per square foot. 3241 River Landing Dr is a home located in West Baton Rouge Parish with nearby schools including Brusly Elementary School, Lukeville Upper Elementary School, and Brusly Middle School.
Ownership History
Date
Name
Owned For
Owner Type
Purchase Details
Closed on
May 16, 2013
Sold by
Thai Truc and Le Duc
Bought by
Radford Ben G and Radford Krishum M
Current Estimated Value
Home Financials for this Owner
Home Financials are based on the most recent Mortgage that was taken out on this home.
Original Mortgage
$227,551
Outstanding Balance
$160,882
Interest Rate
3.43%
Mortgage Type
New Conventional
Estimated Equity
$142,404
Purchase Details
Closed on
Jun 12, 2006
Sold by
Foote Roselle S
Bought by
Le Duc and Thai Truc
Home Financials for this Owner
Home Financials are based on the most recent Mortgage that was taken out on this home.
Original Mortgage
$215,000
Interest Rate
6.56%
Mortgage Type
New Conventional
Purchase Details
Closed on
Oct 28, 2005
Sold by
Metro Construction Llc
Bought by
Foote Roselle S
Home Financials for this Owner
Home Financials are based on the most recent Mortgage that was taken out on this home.
Original Mortgage
$181,620
Interest Rate
5.9%
Mortgage Type
New Conventional
Create a Home Valuation Report for This Property
The Home Valuation Report is an in-depth analysis detailing your home's value as well as a comparison with similar homes in the area
Home Values in the Area
Average Home Value in this Area
Purchase History
| Date | Buyer | Sale Price | Title Company |
|---|---|---|---|
| Radford Ben G | $223,000 | Accent Title Company | |
| Le Duc | $215,000 | None Available | |
| Foote Roselle S | -- | None Available |
Source: Public Records
Mortgage History
| Date | Status | Borrower | Loan Amount |
|---|---|---|---|
| Open | Radford Ben G | $227,551 | |
| Previous Owner | Le Duc | $215,000 | |
| Previous Owner | Foote Roselle S | $181,620 |
Source: Public Records
Tax History Compared to Growth
Tax History
| Year | Tax Paid | Tax Assessment Tax Assessment Total Assessment is a certain percentage of the fair market value that is determined by local assessors to be the total taxable value of land and additions on the property. | Land | Improvement |
|---|---|---|---|---|
| 2024 | $1,661 | $24,650 | $5,500 | $19,150 |
| 2023 | $1,530 | $22,230 | $4,000 | $18,230 |
| 2022 | $2,331 | $22,230 | $4,000 | $18,230 |
| 2021 | $2,384 | $22,230 | $4,000 | $18,230 |
| 2020 | $2,167 | $20,010 | $3,600 | $16,410 |
| 2019 | $2,577 | $22,840 | $3,680 | $19,160 |
| 2018 | $2,624 | $22,840 | $3,680 | $19,160 |
| 2017 | $2,423 | $22,840 | $3,680 | $19,160 |
| 2015 | $1,946 | $22,660 | $3,500 | $19,160 |
| 2014 | $1,915 | $22,660 | $3,500 | $19,160 |
| 2013 | $1,915 | $22,660 | $3,500 | $19,160 |
Source: Public Records
Map
Nearby Homes
- 0 La Highway 1 S
- 0 La Hwy 1 S
- 6989 Louisiana 1
- 6989 La Highway 1
- 6465 Sugar Harvest Ct
- 4758 Bayou Plantation Dr
- 3609 Loup Ln
- 3937 Cypress Hall Dr
- 3855 Sandbar Dr
- 3954 Olivia Dr
- 3675 Union Dr
- 3561 Lukeville Ln
- 6378 Yatton Dr
- 3953 Bird Heights Ave
- 407 Gleason St
- 7331 S La Hwy 1
- 6782 Eliza Dr
- 6465 Clarkland Blvd
- 4413 Boulevard Acadian
- 4434 Olivia Dr
- 3241 River Landing
- 3231 River Landing Dr
- 3251 River Landing
- 3240 Rivers Edge Dr
- 3230 Rivers Edge Dr
- 3250 Rivers Edge Dr
- 3261 River Landing Dr
- 3238 River Landing Dr
- 3248 River Landing Dr
- 3228 River Landing Dr
- 3260 Rivers Edge Dr
- 3211 River Landing Dr
- 3258 River Landing Dr
- 3210 Rivers Edge Dr
- 3218 River Landing Dr
- 3258 River Landing
- 3309 River Landing Dr
- 3314 Rivers Edge Dr
- 3237 Rivers Edge Dr
- 3306 River Landing Dr