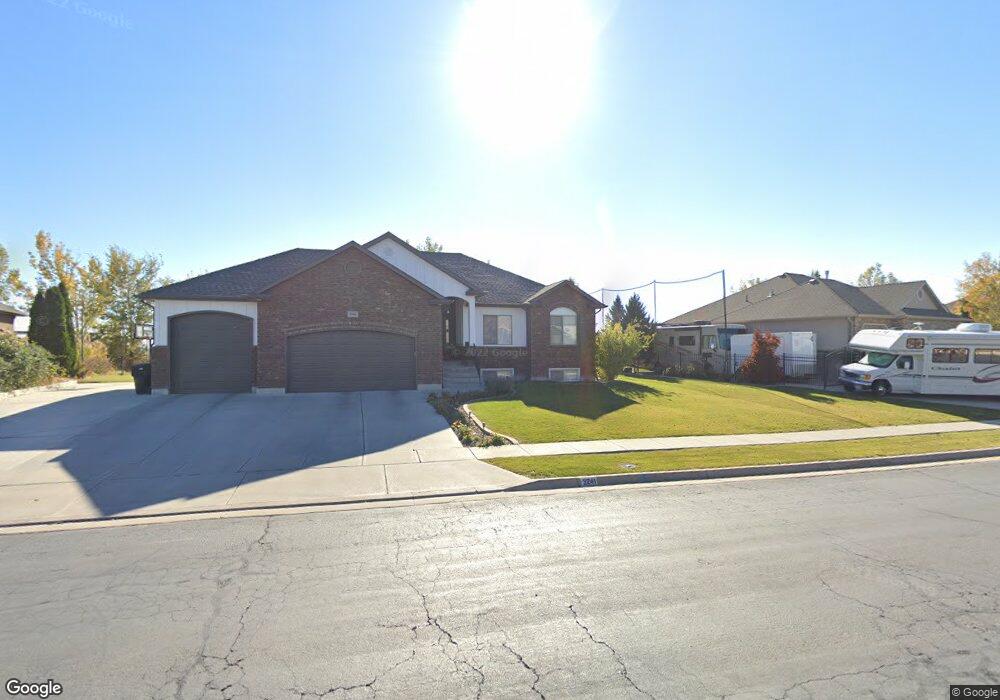
3241 St Andrews Dr Syracuse, UT 84075
Estimated Value: $642,000 - $842,000
3
Beds
2
Baths
3,200
Sq Ft
$224/Sq Ft
Est. Value
About This Home
This home is located at 3241 St Andrews Dr, Syracuse, UT 84075 and is currently estimated at $717,222, approximately $224 per square foot. 3241 St Andrews Dr is a home located in Davis County with nearby schools including Buffalo Point School, Syracuse Junior High School, and Syracuse High School.
Ownership History
Date
Name
Owned For
Owner Type
Purchase Details
Closed on
Jul 31, 2024
Sold by
Green Jonathan A and Green Jllllan K
Bought by
Hokanson Walter Ben and Hokanson Michelle
Current Estimated Value
Home Financials for this Owner
Home Financials are based on the most recent Mortgage that was taken out on this home.
Original Mortgage
$678,000
Outstanding Balance
$672,201
Interest Rate
10%
Mortgage Type
New Conventional
Estimated Equity
$45,021
Purchase Details
Closed on
May 3, 2007
Sold by
Lynn Glauser Construction Lc
Bought by
Green Jonathan A and Green Jillian K
Home Financials for this Owner
Home Financials are based on the most recent Mortgage that was taken out on this home.
Original Mortgage
$67,200
Interest Rate
5.83%
Mortgage Type
Stand Alone Second
Purchase Details
Closed on
Apr 4, 2006
Sold by
Blackburn Jones Real Estate Inc
Bought by
Lynn Glauser Construction Co
Create a Home Valuation Report for This Property
The Home Valuation Report is an in-depth analysis detailing your home's value as well as a comparison with similar homes in the area
Home Values in the Area
Average Home Value in this Area
Purchase History
| Date | Buyer | Sale Price | Title Company |
|---|---|---|---|
| Hokanson Walter Ben | -- | Us Title Insurance Agency | |
| Green Jonathan A | -- | Security Title | |
| Lynn Glauser Construction Co | -- | Us Title Company Of Utah |
Source: Public Records
Mortgage History
| Date | Status | Borrower | Loan Amount |
|---|---|---|---|
| Open | Hokanson Walter Ben | $678,000 | |
| Previous Owner | Green Jonathan A | $67,200 | |
| Previous Owner | Green Jonathan A | $268,800 |
Source: Public Records
Tax History
| Year | Tax Paid | Tax Assessment Tax Assessment Total Assessment is a certain percentage of the fair market value that is determined by local assessors to be the total taxable value of land and additions on the property. | Land | Improvement |
|---|---|---|---|---|
| 2025 | $3,763 | $363,000 | $112,229 | $250,771 |
| 2024 | $3,505 | $340,450 | $92,127 | $248,323 |
| 2023 | $3,317 | $587,000 | $137,174 | $449,826 |
| 2022 | $3,469 | $336,600 | $70,126 | $266,474 |
| 2021 | $3,156 | $474,000 | $102,062 | $371,938 |
| 2020 | $2,847 | $414,000 | $83,843 | $330,157 |
| 2019 | $2,765 | $397,000 | $86,871 | $310,129 |
| 2018 | $2,590 | $369,000 | $84,016 | $284,984 |
| 2016 | $2,533 | $189,310 | $34,426 | $154,884 |
| 2015 | $2,607 | $185,570 | $34,426 | $151,144 |
| 2014 | $2,423 | $175,752 | $34,426 | $141,326 |
| 2013 | -- | $140,225 | $33,629 | $106,596 |
Source: Public Records
Map
Nearby Homes
- 1441 Brookshire Dr
- 3546 Brookshire Dr
- 2935 W 1200 S
- 1829 S 3525 W
- 3805 W Jupiter Hills
- 2885 W 700 S
- 2679 W Antelope Dr
- 1899 S 3720 W
- 3971 W 975 S
- 1074 S 4000 W
- 4068 W 1200 S
- 2584 S 2430 St W Unit 502
- 2613 S 2430 W Unit 111
- 2614 S 2430 W Unit 106
- 2665 S 2430 W Unit 118
- 2663 S 2430 W
- 792 S 4000 W
- 3684 W 2170 S Unit 112
- 4193 W 1175 S
- 2115 Fremont Crest Ave
- 3241 Saint Andrews Dr
- 3259 Saint Andrews Dr
- 3223 St Andrews Dr
- 3223 Saint Andrews Dr
- 3244 St Andrews Dr
- 3244 Saint Andrews Dr
- 3226 Saint Andrews Dr
- 3207 St Andrews Dr
- 3279 Saint Andrews Dr
- 3264 Saint Andrews Dr
- 3207 Saint Andrews Dr
- 3264 St Andrews Dr
- 3282 Saint Andrews Dr
- 3261 Newcastle Cir
- 1256 Shotley Bridge Dr
- 3189 Saint Andrews Dr
- 3194 Saint Andrews Dr
- 3293 Saint Andrews Dr
- 3194 St Andrews Dr
- 1234 Shotley Bridge Dr
Your Personal Tour Guide
Ask me questions while you tour the home.