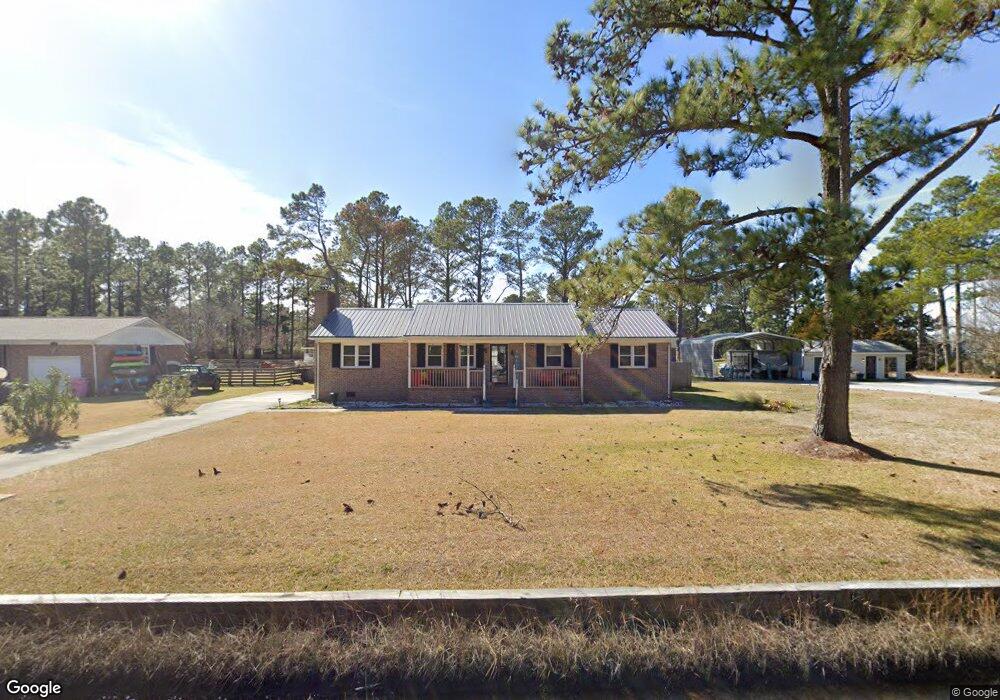
3241 Us Highway 70 E Beaufort, NC 28516
Estimated Value: $320,000 - $396,000
3
Beds
2
Baths
1,724
Sq Ft
$210/Sq Ft
Est. Value
About This Home
This home is located at 3241 Us Highway 70 E, Beaufort, NC 28516 and is currently estimated at $361,976, approximately $209 per square foot. 3241 Us Highway 70 E is a home located in Carteret County with nearby schools including Beaufort Elementary School, Beaufort Middle School, and East Carteret High School.
Ownership History
Date
Name
Owned For
Owner Type
Purchase Details
Closed on
Feb 16, 2023
Sold by
Bruner Pamela King
Bought by
Molinari Joseph and Molinari Kristy
Current Estimated Value
Home Financials for this Owner
Home Financials are based on the most recent Mortgage that was taken out on this home.
Original Mortgage
$319,113
Outstanding Balance
$306,901
Interest Rate
6.13%
Mortgage Type
FHA
Estimated Equity
$55,075
Purchase Details
Closed on
Nov 7, 2022
Sold by
Pamela King Bruner Irrevocable Trust
Bought by
Bruner Pamela King
Purchase Details
Closed on
Mar 4, 2022
Sold by
Bruner Pamela King
Bought by
Bruner Pamela King and Robin Bruner Hill Revocable Trust
Purchase Details
Closed on
Apr 13, 2012
Sold by
Smallwood Evelyn Marie
Bought by
Bruner Harold W and Bruner Pamela K
Purchase Details
Closed on
Apr 23, 2009
Sold by
Smallwood Evelyn M
Bought by
Smallwood Evelyn Marie and Evelyn Marie Smallwood Revocable Living
Create a Home Valuation Report for This Property
The Home Valuation Report is an in-depth analysis detailing your home's value as well as a comparison with similar homes in the area
Home Values in the Area
Average Home Value in this Area
Purchase History
| Date | Buyer | Sale Price | Title Company |
|---|---|---|---|
| Molinari Joseph | $325,000 | -- | |
| Bruner Pamela King | -- | -- | |
| Bruner Pamela King | -- | None Listed On Document | |
| Pamela King Bruner Irrevocable Trust | -- | None Listed On Document | |
| Bruner Harold W | $135,000 | None Available | |
| Smallwood Evelyn Marie | -- | None Available |
Source: Public Records
Mortgage History
| Date | Status | Borrower | Loan Amount |
|---|---|---|---|
| Open | Molinari Joseph | $319,113 |
Source: Public Records
Tax History
| Year | Tax Paid | Tax Assessment Tax Assessment Total Assessment is a certain percentage of the fair market value that is determined by local assessors to be the total taxable value of land and additions on the property. | Land | Improvement |
|---|---|---|---|---|
| 2025 | $1,111 | $321,614 | $31,691 | $289,923 |
| 2024 | $1,017 | $195,535 | $62,762 | $132,773 |
| 2023 | $1,091 | $195,535 | $62,762 | $132,773 |
| 2022 | $1,071 | $195,535 | $62,762 | $132,773 |
| 2021 | $1,071 | $195,535 | $62,762 | $132,773 |
| 2020 | $1,187 | $195,535 | $62,762 | $132,773 |
| 2019 | $1,187 | $203,427 | $62,762 | $140,665 |
| 2017 | $1,207 | $203,427 | $62,762 | $140,665 |
| 2016 | $1,047 | $169,913 | $42,889 | $127,024 |
| 2015 | $1,030 | $169,913 | $42,889 | $127,024 |
| 2014 | -- | $159,102 | $59,248 | $99,854 |
Source: Public Records
Map
Nearby Homes
- 102 Colonial St
- 2973 U S 70
- 2917 U S 70
- 204 Tamassee N
- 101 Scouts Bend Rd
- 119 Radley Ln
- 111 Golden Finch Dr
- 109 Golden Finch Dr
- 101 Golden Finch Dr
- 103 Golden Finch Dr
- 102 Golden Finch Dr
- 106 Finch Loop
- 157 Sunrise Dr
- 2622 U S 70
- 100 Tiffany Way
- 203 Willet Dr
- 117 Arthur Rd
- 136 Bettie Path Rd
- 385 Hwy 70 Bettie
- 222 Windswept Ln
- 3241&3249 Hwy 70
- 3241&3249 Us Highway 70
- 3241 U S 70
- 3241 Hwy 70 Beaufort
- 3237 Us Highway 70 E
- 3237 U S 70
- 106 Pleasant Dr
- 100 Pleasant Dr
- 3250 U S 70
- 3250 Us Highway 70 E
- 107 Pleasant Dr
- 3260 U S 70
- 3230 U S 70
- 3230 U S 70
- 0000 Hwy 70 E
- 0000 Hwy 70 E
- 3230 Hwy 70 E
- 109 Pleasant Dr
- 110 Pleasant Dr
- 3203 Us Highway 70 E
Your Personal Tour Guide
Ask me questions while you tour the home.