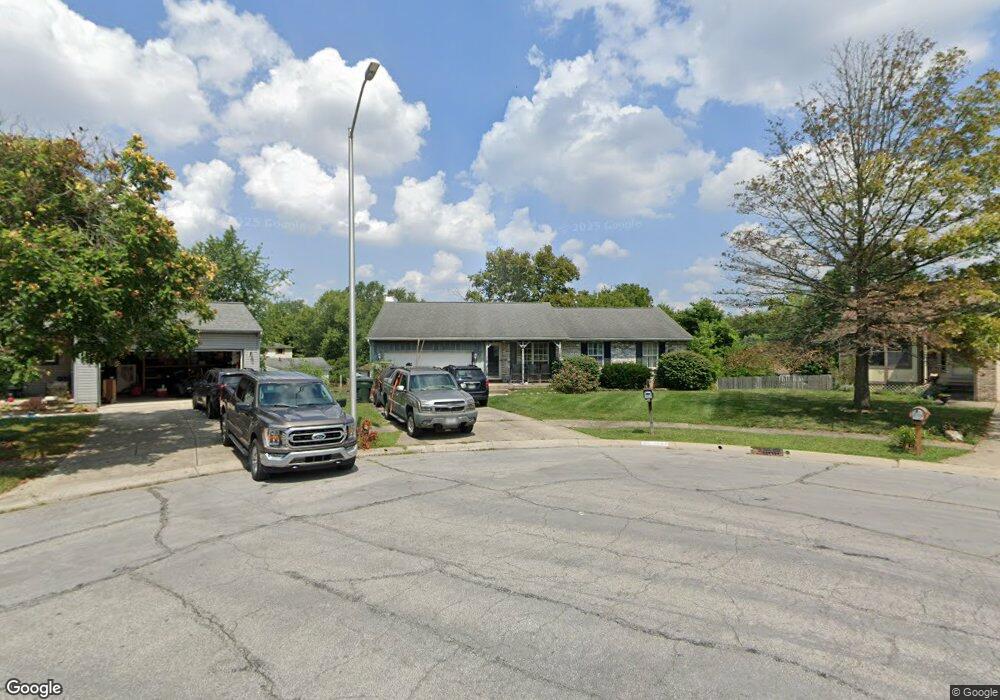
3243 Bluhm Ct Columbus, OH 43223
Riverbend NeighborhoodEstimated Value: $268,122 - $302,000
3
Beds
2
Baths
1,420
Sq Ft
$199/Sq Ft
Est. Value
About This Home
This home is located at 3243 Bluhm Ct, Columbus, OH 43223 and is currently estimated at $283,031, approximately $199 per square foot. 3243 Bluhm Ct is a home located in Franklin County with nearby schools including James A Harmon Elementary School, Franklin Woods Intermediate School, and Finland Middle School.
Ownership History
Date
Name
Owned For
Owner Type
Purchase Details
Closed on
Jun 19, 2008
Sold by
Greenpoint Mortgage Funding Inc
Bought by
Adams Charles P
Current Estimated Value
Home Financials for this Owner
Home Financials are based on the most recent Mortgage that was taken out on this home.
Original Mortgage
$119,059
Outstanding Balance
$76,789
Interest Rate
6.15%
Mortgage Type
FHA
Estimated Equity
$206,242
Purchase Details
Closed on
Feb 15, 2008
Sold by
Rucker Aneka M and Case #2-07-Cv-588
Bought by
Greenpoint Mortgage Funding Inc and Sarm 2005-5 Trust Fund
Purchase Details
Closed on
Aug 21, 2003
Sold by
Wickwire David M
Bought by
Rucker Aneka M
Home Financials for this Owner
Home Financials are based on the most recent Mortgage that was taken out on this home.
Original Mortgage
$79,800
Interest Rate
7.34%
Mortgage Type
Purchase Money Mortgage
Purchase Details
Closed on
Jul 2, 1998
Sold by
Weeney James D
Bought by
Wickwire David M
Purchase Details
Closed on
Nov 4, 1993
Create a Home Valuation Report for This Property
The Home Valuation Report is an in-depth analysis detailing your home's value as well as a comparison with similar homes in the area
Home Values in the Area
Average Home Value in this Area
Purchase History
| Date | Buyer | Sale Price | Title Company |
|---|---|---|---|
| Adams Charles P | $120,000 | Attorney | |
| Greenpoint Mortgage Funding Inc | $122,474 | None Available | |
| Rucker Aneka M | $84,000 | Landsel | |
| Wickwire David M | $102,000 | -- | |
| -- | $99,100 | -- |
Source: Public Records
Mortgage History
| Date | Status | Borrower | Loan Amount |
|---|---|---|---|
| Open | Adams Charles P | $119,059 | |
| Previous Owner | Rucker Aneka M | $79,800 |
Source: Public Records
Tax History Compared to Growth
Tax History
| Year | Tax Paid | Tax Assessment Tax Assessment Total Assessment is a certain percentage of the fair market value that is determined by local assessors to be the total taxable value of land and additions on the property. | Land | Improvement |
|---|---|---|---|---|
| 2024 | $3,055 | $83,800 | $16,910 | $66,890 |
| 2023 | $3,001 | $83,790 | $16,905 | $66,885 |
| 2022 | $2,525 | $51,730 | $8,400 | $43,330 |
| 2021 | $2,792 | $51,730 | $8,400 | $43,330 |
| 2020 | $2,561 | $51,730 | $8,400 | $43,330 |
| 2019 | $2,370 | $42,250 | $7,000 | $35,250 |
| 2018 | $2,383 | $42,250 | $7,000 | $35,250 |
| 2017 | $2,377 | $42,250 | $7,000 | $35,250 |
| 2016 | $2,406 | $39,770 | $6,900 | $32,870 |
| 2015 | $2,406 | $39,770 | $6,900 | $32,870 |
| 2014 | $2,408 | $39,770 | $6,900 | $32,870 |
| 2013 | $1,327 | $44,170 | $7,665 | $36,505 |
Source: Public Records
Map
Nearby Homes
- 3326 Bluhm Ct
- 1657 Ripplebrook Rd
- 1465 Tall Meadows Dr
- 3488 Rocky Rd
- 3206 Andy Terrace
- 2930 Alkire Rd
- 2800 Alkire Rd
- 3623 High Creek Dr
- 1520 Fall Brook Rd
- 2987 Daisy Ln
- 1485 Demorest Rd
- 1181 Onslow Dr
- 1830 Winding Hollow Dr
- 1226 Pinnacle Dr
- 1248 Gresham Rd
- 3728 Greenock Ct
- 2062 Summer Banks Dr
- 2856 Chesfield Dr
- 0 Glencreek Rd
- 2894 Creith Ct
- 3249 Bluhm Ct
- 3347 Robin Hill Ct W
- 3353 Robin Hill Ct W
- 3255 Bluhm Ct
- 3335 Robin Hill Ct W
- 1635 Greenville Rd
- 1629 Greenville Rd
- 1641 Greenville Rd
- 1647 Greenville Rd
- 3365 Robin Hill Ct W
- 3261 Bluhm Ct
- 1623 Greenville Rd
- 1653 Greenville Rd
- 3252 Bluhm Ct
- 3260 Bluhm Ct
- 3267 Bluhm Ct
- 3274 Bluhm Ct
- 3371 Robin Hill Ct W
- 3344 Robin Hill Ct W
- 3350 Robin Hill Ct W