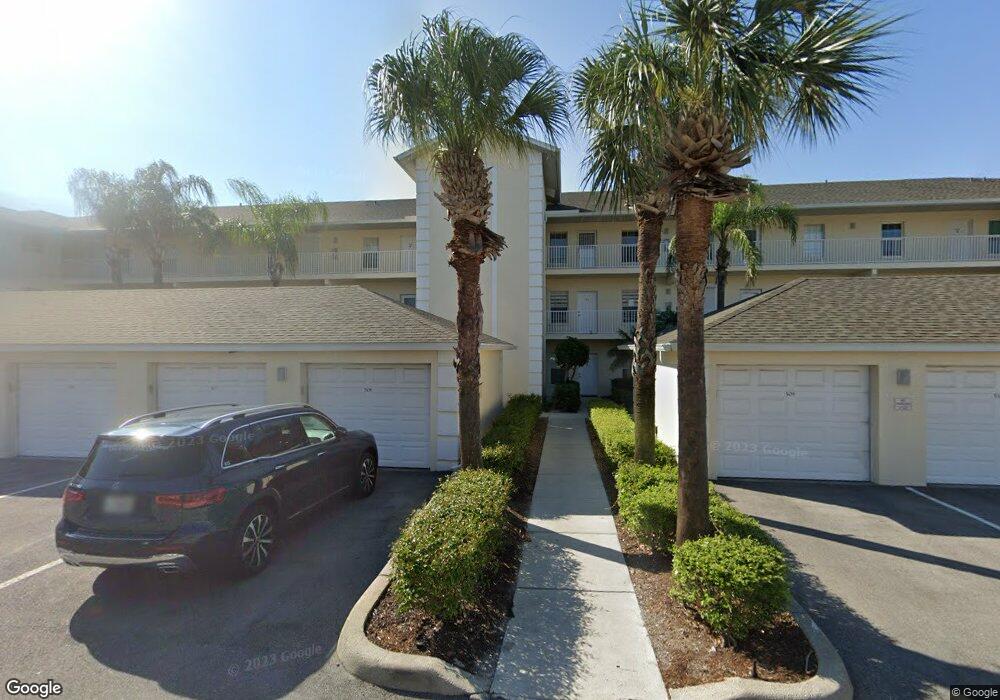
3245 Cypress Glen Way Unit 503 Naples, FL 34109
North Central Naples NeighborhoodEstimated Value: $255,618 - $294,000
--
Bed
--
Bath
1,191
Sq Ft
$228/Sq Ft
Est. Value
About This Home
This home is located at 3245 Cypress Glen Way Unit 503, Naples, FL 34109 and is currently estimated at $271,655, approximately $228 per square foot. 3245 Cypress Glen Way Unit 503 is a home located in Collier County with nearby schools including Osceola Elementary School, Pine Ridge Middle School, and Barron Collier High School.
Ownership History
Date
Name
Owned For
Owner Type
Purchase Details
Closed on
Jan 28, 2011
Sold by
Monaic Capital Mgt Inc
Bought by
Vanderbilt Beach Properties Llc
Current Estimated Value
Purchase Details
Closed on
Jul 30, 2009
Sold by
Wachovia Mortgage Fsb
Bought by
Manaia Capital Management Inc
Purchase Details
Closed on
Jun 30, 2009
Sold by
Natvig Daniel S and Natvig Cheryl L
Bought by
Wachovia Mortgage Fsb
Purchase Details
Closed on
Dec 22, 1999
Sold by
Mccuan Patrick
Bought by
Natvig Daniel S and Natvig Cheryl L
Purchase Details
Closed on
Sep 29, 1999
Sold by
Cypress Glen Dev Corp
Bought by
Natvig Daniel S and Natvig Cheryl L
Home Financials for this Owner
Home Financials are based on the most recent Mortgage that was taken out on this home.
Original Mortgage
$91,900
Interest Rate
7.89%
Create a Home Valuation Report for This Property
The Home Valuation Report is an in-depth analysis detailing your home's value as well as a comparison with similar homes in the area
Home Values in the Area
Average Home Value in this Area
Purchase History
| Date | Buyer | Sale Price | Title Company |
|---|---|---|---|
| Vanderbilt Beach Properties Llc | -- | None Available | |
| Manaia Capital Management Inc | $86,000 | Coastal Title Inc | |
| Wachovia Mortgage Fsb | -- | None Available | |
| Natvig Daniel S | -- | -- | |
| Natvig Daniel S | $95,800 | -- |
Source: Public Records
Mortgage History
| Date | Status | Borrower | Loan Amount |
|---|---|---|---|
| Previous Owner | Natvig Daniel S | $91,900 |
Source: Public Records
Tax History Compared to Growth
Tax History
| Year | Tax Paid | Tax Assessment Tax Assessment Total Assessment is a certain percentage of the fair market value that is determined by local assessors to be the total taxable value of land and additions on the property. | Land | Improvement |
|---|---|---|---|---|
| 2025 | $2,107 | $223,890 | -- | -- |
| 2024 | $2,146 | $203,536 | -- | -- |
| 2023 | $2,146 | $185,033 | $0 | $0 |
| 2022 | $1,908 | $168,212 | $0 | $0 |
| 2021 | $1,670 | $152,920 | $0 | $152,920 |
| 2020 | $1,653 | $152,920 | $0 | $152,920 |
| 2019 | $1,595 | $140,769 | $0 | $0 |
| 2018 | $1,457 | $127,972 | $0 | $0 |
| 2017 | $1,401 | $116,338 | $0 | $0 |
| 2016 | $1,314 | $105,762 | $0 | $0 |
| 2015 | $1,246 | $96,147 | $0 | $0 |
| 2014 | -- | $87,406 | $0 | $0 |
Source: Public Records
Map
Nearby Homes
- 3235 Cypress Glen Way Unit 307
- 3250 Cypress Glen Way Unit 404
- 3051 Lancaster Dr Unit 2
- 3019 Lancaster Dr Unit 3
- 3099 Lancaster Dr Unit 2
- 5274 Kensington High St
- 3310 Hamlet Dr Unit 3
- 5025 Blauvelt Way Unit 101
- 5004 Maxwell Cir Unit 3-202
- 6940 Bottlebrush Ln
- 12907 Brynwood Preserve Ln
- 12953 Pembroke Dr
- 4208 Kensington High St
- 12940 Pembroke Dr
- 4980 Rustic Oaks Cir
- 5072 Kensington High St
- 3245 Cypress Glen Way
- 3245 Cypress Glen Way
- 3245 Cypress Glen Way Unit 524
- 3245 Cypress Glen Way Unit 522
- 3245 Cypress Glen Way Unit 518
- 3245 Cypress Glen Way Unit 516
- 3245 Cypress Glen Way Unit 514
- 3245 Cypress Glen Way Unit 512
- 3245 Cypress Glen Way Unit 507
- 3245 Cypress Glen Way Unit 506
- 3245 Cypress Glen Way Unit 504
- 3245 Cypress Glen Way Unit 509
- 3245 Cypress Glen Way Unit 513
- 3245 Cypress Glen Way Unit 511
- 3245 Cypress Glen Way Unit 510
- 3245 Cypress Glen Way Unit 513
- 3245 Cypress Glen Way Unit 520
- 3245 Cypress Glen Way Unit 517
- 3245 Cypress Glen Way Unit 521
- 3245 Cypress Glen Way Unit 523