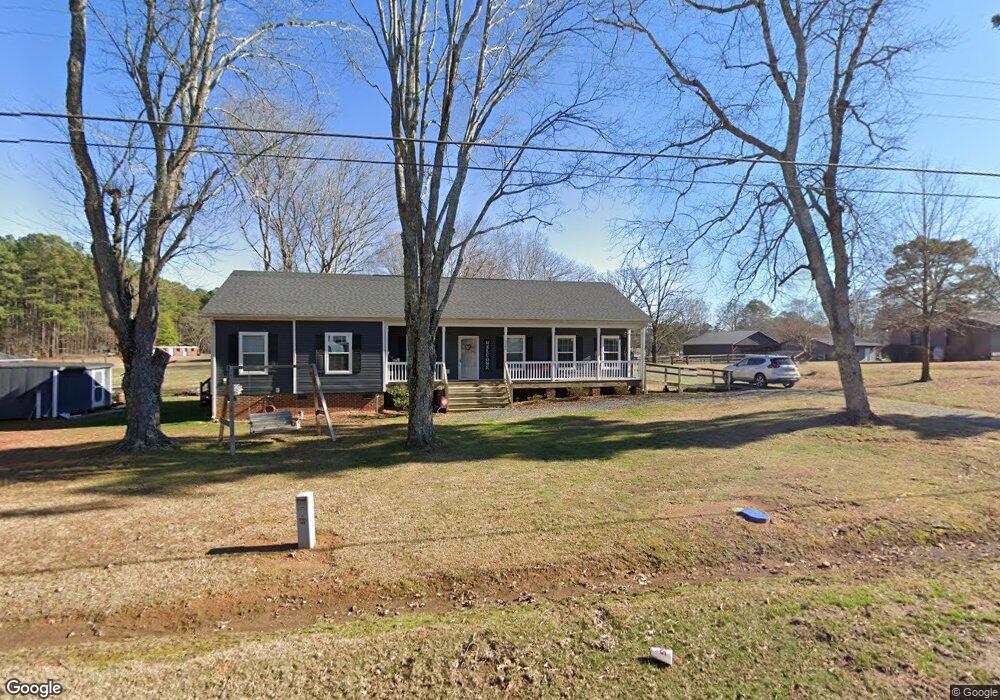
3246 Deep River Rd Sanford, NC 27330
Estimated Value: $278,000 - $346,000
3
Beds
2
Baths
1,740
Sq Ft
$184/Sq Ft
Est. Value
About This Home
This home is located at 3246 Deep River Rd, Sanford, NC 27330 and is currently estimated at $319,301, approximately $183 per square foot. 3246 Deep River Rd is a home located in Lee County with nearby schools including Deep River Elementary School, East Lee Middle School, and Lee County High School.
Ownership History
Date
Name
Owned For
Owner Type
Purchase Details
Closed on
Jul 3, 2018
Sold by
Lewis David Kelly
Bought by
Griffin Franklin and Griffin Lou
Current Estimated Value
Home Financials for this Owner
Home Financials are based on the most recent Mortgage that was taken out on this home.
Original Mortgage
$165,389
Outstanding Balance
$143,493
Interest Rate
4.55%
Estimated Equity
$175,808
Purchase Details
Closed on
May 23, 2018
Sold by
Kelly Lewis David and Kelly Linda Keck
Bought by
Griffin Franklin E and Griffin Lou Anne
Home Financials for this Owner
Home Financials are based on the most recent Mortgage that was taken out on this home.
Original Mortgage
$165,389
Outstanding Balance
$143,493
Interest Rate
4.55%
Estimated Equity
$175,808
Purchase Details
Closed on
May 19, 2003
Sold by
Thomas Frances J
Bought by
Kelly Lewis David
Purchase Details
Closed on
Nov 20, 2001
Sold by
Johnson J Lynville
Bought by
Thomas Frances J
Create a Home Valuation Report for This Property
The Home Valuation Report is an in-depth analysis detailing your home's value as well as a comparison with similar homes in the area
Home Values in the Area
Average Home Value in this Area
Purchase History
| Date | Buyer | Sale Price | Title Company |
|---|---|---|---|
| Griffin Franklin | -- | -- | |
| Griffin Franklin E | -- | None Available | |
| Kelly Lewis David | $52,000 | -- | |
| Thomas Frances J | -- | -- |
Source: Public Records
Mortgage History
| Date | Status | Borrower | Loan Amount |
|---|---|---|---|
| Open | Griffin Franklin | $165,389 | |
| Closed | Griffin Franklin | -- |
Source: Public Records
Tax History Compared to Growth
Tax History
| Year | Tax Paid | Tax Assessment Tax Assessment Total Assessment is a certain percentage of the fair market value that is determined by local assessors to be the total taxable value of land and additions on the property. | Land | Improvement |
|---|---|---|---|---|
| 2025 | $1,825 | $219,600 | $33,000 | $186,600 |
| 2024 | $1,815 | $219,600 | $33,000 | $186,600 |
| 2023 | $1,771 | $219,600 | $33,000 | $186,600 |
| 2022 | $1,370 | $145,100 | $27,100 | $118,000 |
| 2021 | $1,390 | $143,900 | $27,100 | $116,800 |
| 2020 | $1,388 | $143,900 | $27,100 | $116,800 |
| 2019 | $1,388 | $143,900 | $27,100 | $116,800 |
| 2018 | $84 | $9,100 | $9,100 | $0 |
| 2017 | $84 | $9,100 | $9,100 | $0 |
| 2016 | $84 | $9,100 | $9,100 | $0 |
| 2014 | $76 | $9,100 | $9,100 | $0 |
Source: Public Records
Map
Nearby Homes
- 3212 Deep River Rd
- 00 Big Oaks Ln
- 3241 Deep River Rd
- 3223 Deep River Rd
- 3294 Deep River Rd
- 3190 Deep River Rd
- 80 Big Oaks Ln
- 3195 Deep River Rd
- 3197 Deep River Rd
- 3320 Deep River Rd
- 3346 Deep River Rd
- 53 Phil Johnson Rd
- 3128 Deep River Rd
- 3353 Deep River Rd
- 3353 Deep River Rd
- 1728 Zion Church Rd Unit 1
- 131 Phil Johnson Rd
- 1864 Zion Church Rd
- 130 Phil Johnson Rd
- 1894 Zion Church Rd