3246 Split Oak Ct Abingdon, MD 21009
Estimated Value: $249,026 - $306,000
Studio
2
Baths
1,240
Sq Ft
$231/Sq Ft
Est. Value
About This Home
This home is located at 3246 Split Oak Ct, Abingdon, MD 21009 and is currently estimated at $286,007, approximately $230 per square foot. 3246 Split Oak Ct is a home located in Harford County with nearby schools including Abingdon Elementary School, Edgewood Middle School, and Edgewood High School.
Ownership History
Date
Name
Owned For
Owner Type
Purchase Details
Closed on
Aug 23, 2006
Sold by
Raymond Bartholow
Bought by
Raymond Bartholow and Bridges Kelly
Current Estimated Value
Home Financials for this Owner
Home Financials are based on the most recent Mortgage that was taken out on this home.
Original Mortgage
$175,900
Outstanding Balance
$105,090
Interest Rate
6.67%
Mortgage Type
Stand Alone Refi Refinance Of Original Loan
Estimated Equity
$180,917
Purchase Details
Closed on
Jul 11, 2006
Sold by
Raymond Bartholow
Bought by
Raymond Bartholow and Bridges Kelly
Home Financials for this Owner
Home Financials are based on the most recent Mortgage that was taken out on this home.
Original Mortgage
$175,900
Outstanding Balance
$105,090
Interest Rate
6.67%
Mortgage Type
Stand Alone Refi Refinance Of Original Loan
Estimated Equity
$180,917
Purchase Details
Closed on
Aug 6, 2004
Sold by
Hagmeier Karen
Bought by
Raymond Bartholow and Raymond Bartholow
Purchase Details
Closed on
May 15, 2002
Sold by
Ames Sharon J
Bought by
Hagmeier Karen
Create a Home Valuation Report for This Property
The Home Valuation Report is an in-depth analysis detailing your home's value as well as a comparison with similar homes in the area
Home Values in the Area
Average Home Value in this Area
Purchase History
| Date | Buyer | Sale Price | Title Company |
|---|---|---|---|
| Raymond Bartholow | -- | -- | |
| Raymond Bartholow | -- | -- | |
| Raymond Bartholow | $140,000 | -- | |
| Hagmeier Karen | $110,000 | -- |
Source: Public Records
Mortgage History
| Date | Status | Borrower | Loan Amount |
|---|---|---|---|
| Open | Raymond Bartholow | $175,900 | |
| Closed | Raymond Bartholow | $175,900 | |
| Closed | Raymond Bartholow | -- |
Source: Public Records
Tax History
| Year | Tax Paid | Tax Assessment Tax Assessment Total Assessment is a certain percentage of the fair market value that is determined by local assessors to be the total taxable value of land and additions on the property. | Land | Improvement |
|---|---|---|---|---|
| 2025 | $2,066 | $208,200 | $0 | $0 |
| 2024 | $2,066 | $194,100 | $0 | $0 |
| 2023 | $1,962 | $180,000 | $60,500 | $119,500 |
| 2022 | $1,912 | $175,400 | $0 | $0 |
| 2021 | $1,918 | $170,800 | $0 | $0 |
| 2020 | $1,918 | $166,200 | $60,500 | $105,700 |
| 2019 | $1,899 | $164,600 | $0 | $0 |
| 2018 | $1,864 | $163,000 | $0 | $0 |
| 2017 | $1,846 | $161,400 | $0 | $0 |
| 2016 | -- | $160,000 | $0 | $0 |
| 2015 | $1,917 | $158,600 | $0 | $0 |
| 2014 | $1,917 | $157,200 | $0 | $0 |
Source: Public Records
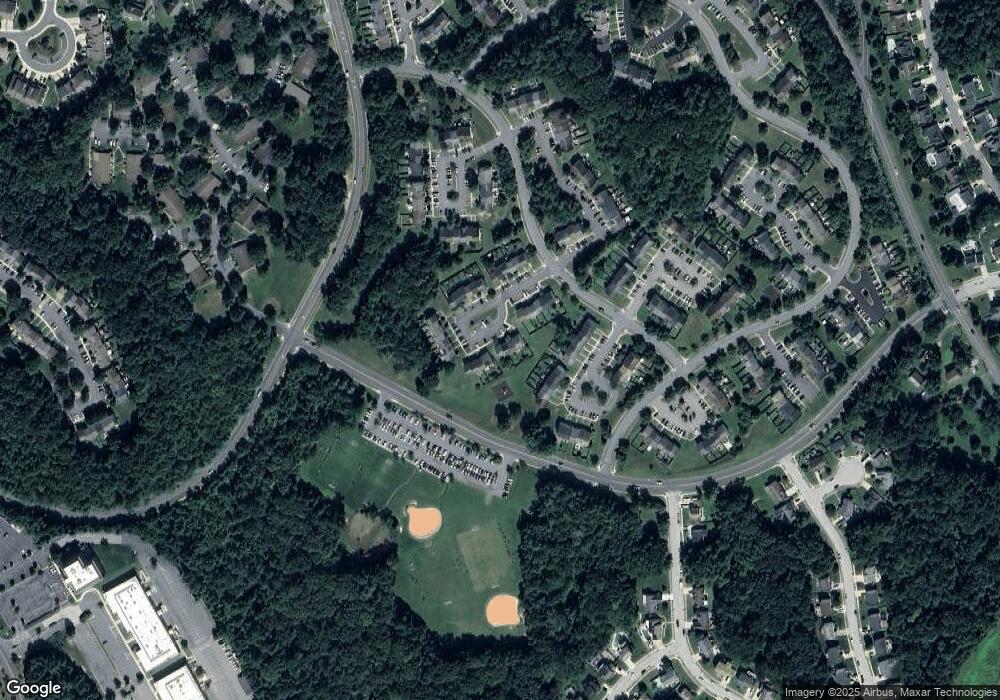
Map
Nearby Homes
- 3102 Laurel Bush Rd
- 404 Arrow Wood Ct
- 115 Hastings Ct
- 3154 Birch Brook Ln
- 2961 Harrogate Way
- 3203 Eastbend Ct
- 2917 Brightwater Ln
- 2923 Alconbury Ct
- 2930 Haddington Ct
- 2921 Shelley Ct
- 3109 Eden Dr
- 3101 Cardinal Way Unit D
- 2000 Treese Unit DEVONSHIRE
- 2000 Treese Unit SAVANNAH
- 2000 Treese Unit MAGNOLIA
- 2000 Treese Unit COVINGTON
- 3303 Trellis Ln
- 201 Windmille Pointe Ct Unit 2C
- 3510 Thomas Pointe Ct Unit 2A
- 203 Crosse Pointe 1d Ct Unit 1D
- 3248 Split Oak Ct
- 3250 Split Oak Ct
- 3244 Split Oak Ct
- 3252 Split Oak Ct
- 3242 Split Oak Ct
- 3240 Split Oak Ct
- 3238 Split Oak Ct
- 3254 Split Oak Ct
- 3236 Rock Creek Ct
- 3234 Rock Creek Ct
- 3256 Split Oak Ct
- 3420 Winter Moss Ct
- 3418 Winter Moss Ct
- 3422 Winter Moss Ct
- 3416 Winter Moss Ct
- 3424 Winter Moss Ct
- 3258 Split Oak Ct
- 3414 Winter Moss Ct
- 3236 Split Oak Ct
- 3260 Split Oak Ct
Your Personal Tour Guide
Ask me questions while you tour the home.