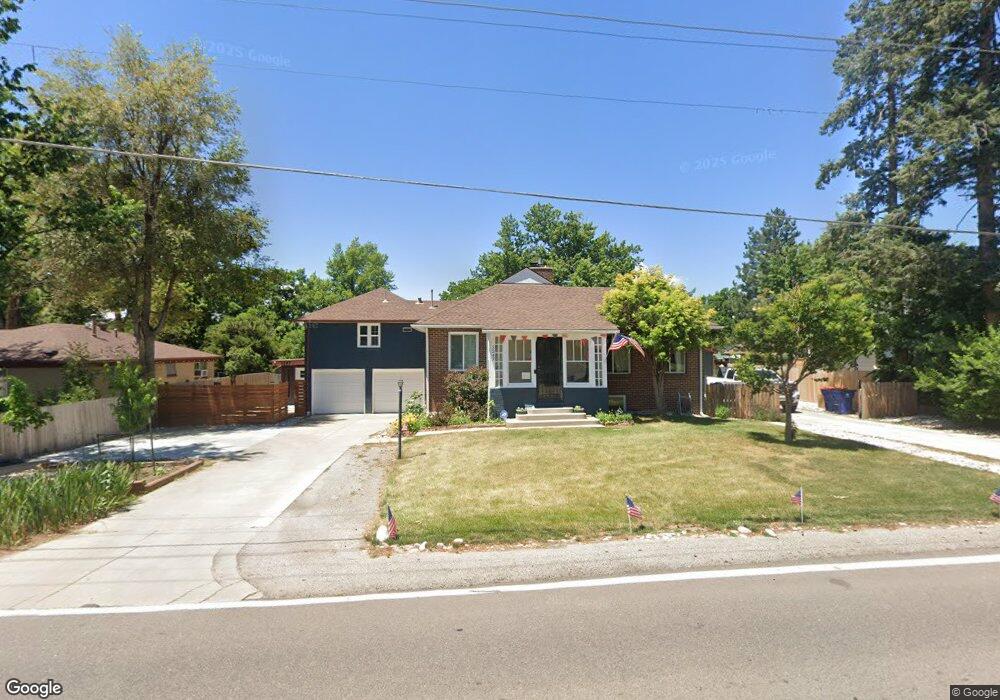
3247 Harlan St Wheat Ridge, CO 80033
Barths NeighborhoodEstimated Value: $625,000 - $821,000
4
Beds
3
Baths
1,464
Sq Ft
$485/Sq Ft
Est. Value
About This Home
This home is located at 3247 Harlan St, Wheat Ridge, CO 80033 and is currently estimated at $709,648, approximately $484 per square foot. 3247 Harlan St is a home located in Jefferson County with nearby schools including Stevens Elementary School, Everitt Middle School, and Wheat Ridge High School.
Ownership History
Date
Name
Owned For
Owner Type
Purchase Details
Closed on
Sep 21, 2017
Sold by
Wanzeck Jennifer Lynn
Bought by
Wanzeck Tyler Ross
Current Estimated Value
Home Financials for this Owner
Home Financials are based on the most recent Mortgage that was taken out on this home.
Original Mortgage
$420,000
Outstanding Balance
$289,686
Interest Rate
3.89%
Mortgage Type
New Conventional
Estimated Equity
$419,962
Purchase Details
Closed on
Sep 4, 2015
Sold by
Rambossek Elizabeth M
Bought by
Wanzeck Tyler Ross and Wanzeck Jennifer Lynn
Home Financials for this Owner
Home Financials are based on the most recent Mortgage that was taken out on this home.
Original Mortgage
$270,799
Interest Rate
3.5%
Mortgage Type
Adjustable Rate Mortgage/ARM
Create a Home Valuation Report for This Property
The Home Valuation Report is an in-depth analysis detailing your home's value as well as a comparison with similar homes in the area
Home Values in the Area
Average Home Value in this Area
Purchase History
| Date | Buyer | Sale Price | Title Company |
|---|---|---|---|
| Wanzeck Tyler Ross | -- | None Available | |
| Wanzeck Tyler Ross | $300,888 | Land Title Guarantee Company |
Source: Public Records
Mortgage History
| Date | Status | Borrower | Loan Amount |
|---|---|---|---|
| Open | Wanzeck Tyler Ross | $420,000 | |
| Closed | Wanzeck Tyler Ross | $270,799 |
Source: Public Records
Tax History Compared to Growth
Tax History
| Year | Tax Paid | Tax Assessment Tax Assessment Total Assessment is a certain percentage of the fair market value that is determined by local assessors to be the total taxable value of land and additions on the property. | Land | Improvement |
|---|---|---|---|---|
| 2024 | $3,250 | $37,169 | $20,091 | $17,078 |
| 2023 | $3,250 | $37,169 | $20,091 | $17,078 |
| 2022 | $3,166 | $35,556 | $19,231 | $16,325 |
| 2021 | $3,210 | $36,579 | $19,784 | $16,795 |
| 2020 | $2,900 | $33,218 | $17,699 | $15,519 |
| 2019 | $2,654 | $30,811 | $17,699 | $13,112 |
| 2018 | $2,425 | $27,219 | $12,045 | $15,174 |
| 2017 | $2,190 | $27,219 | $12,045 | $15,174 |
| 2016 | $1,967 | $22,880 | $8,234 | $14,646 |
| 2015 | $982 | $22,880 | $8,234 | $14,646 |
| 2014 | $982 | $18,671 | $6,190 | $12,481 |
Source: Public Records
Map
Nearby Homes
- 3022 Fenton St
- 3515 Gray St
- 3342 Marshall St
- 6500 W 32nd Ave
- 3530 Fenton St
- 6000 W 29th Ave
- 2890 N Harlan St Unit 102
- 3019 Chase St
- 5904 W 37th Place
- 2933 Benton St
- 2777 Kendall St
- 3530 Chase St
- 3450 Benton St
- 3625 Chase St
- 3500 Otis St
- 6795 W 31st Ave
- 3280 Ames St
- 3100 Ames St
- 6145 W 38th Ave
- 2834 Benton St
- 3255 Harlan St
- 3225 Harlan St
- 3220 Ingalls St
- 3275 Harlan St
- 3230 Ingalls St
- 3210 Ingalls St
- 3215 Harlan St
- 3280 Ingalls St
- 3248 Harlan St
- 3270 Harlan St
- 3295 Harlan St
- 3280 Harlan St
- 3290 Ingalls St
- 6015 W 32nd Ave
- 6017 W 32nd Ave
- 6001 W 32nd Ave
- 3290 Harlan St
- 6027 W 32nd Ave
- 3275 Ingalls St
- 3255 Ingalls St