3248 Morcom Ave Oakland, CA 94619
Maxwell Park NeighborhoodEstimated Value: $781,000 - $870,125
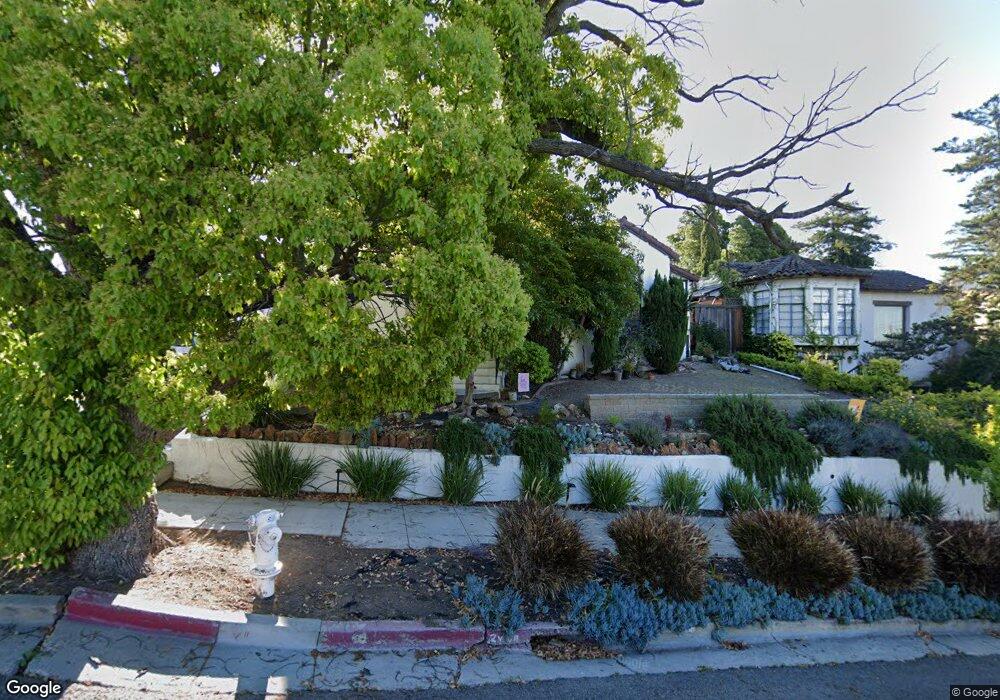
About This Home
This home is located at 3248 Morcom Ave, Oakland, CA 94619 and is currently estimated at $822,531, approximately $655 per square foot. 3248 Morcom Ave is a home located in Alameda County with nearby schools including Laurel Elementary School, Frick United Academy of Language, and Skyline High School.
Ownership History
We collect this data history from publicly available records. To have your information removed, we recommend requesting removal directly through your county’s website.
Purchase Details
Home Financials for this Owner
Home Financials are based on the most recent Mortgage that was taken out on this home.Purchase Details
Purchase Details
Home Values in the Area
Average Home Value in this Area
Purchase History
We collect this data history from publicly available records. To have your information removed, we recommend requesting removal directly through your county’s website.
| Date | Buyer | Sale Price | Title Company |
|---|---|---|---|
| $640,000 | Chicago Title Company | ||
| -- | None Available | ||
| -- | -- |
Mortgage History
We collect this data history from publicly available records. To have your information removed, we recommend requesting removal directly through your county’s website.
| Date | Status | Borrower | Loan Amount |
|---|---|---|---|
| Open | $608,000 |
Tax History
We collect this data history from publicly available records. To have your information removed, we recommend requesting removal directly through your county’s website.
| Year | Tax Paid | Tax Assessment Tax Assessment Total Assessment is a certain percentage of the fair market value that is determined by local assessors to be the total taxable value of land and additions on the property. | Land | Improvement |
|---|---|---|---|---|
| 2025 | $11,011 | $741,583 | $218,459 | $523,124 |
| 2024 | $11,011 | $727,043 | $214,176 | $512,867 |
| 2023 | $11,578 | $712,788 | $209,976 | $502,812 |
| 2022 | $11,291 | $698,815 | $205,860 | $492,955 |
| 2021 | $10,830 | $685,114 | $201,824 | $483,290 |
| 2020 | $10,713 | $678,095 | $199,756 | $478,339 |
| 2019 | $10,169 | $652,800 | $195,840 | $456,960 |
| 2018 | $9,958 | $640,000 | $192,000 | $448,000 |
| 2017 | $1,803 | $50,278 | $25,350 | $24,928 |
| 2016 | $1,646 | $49,292 | $24,853 | $24,439 |
| 2015 | $1,633 | $48,552 | $24,480 | $24,072 |
| 2014 | $1,530 | $47,602 | $24,001 | $23,601 |
Map
- 3264 Madera Ave
- 5229 Macarthur Blvd
- 5301 Brann St
- 5091 Macarthur Blvd
- 3426 Pierson St
- 2924 Morcom Ave
- 3039 Modesto Ave
- 5407 Roberts Ave
- 3311 Kingsland Ave
- 25 Redding Place
- 5922 Camden St
- 5869 Picardy Dr
- 5320 El Camile Ave
- 4770 Tompkins Ave
- 0 Outlook Ave
- 6029 Macarthur Blvd
- 2636 Cole St
- 4475 Redding St
- 6032 Mauritania Ave
- 5814 Fleming Ave
- 3234 Morcom Ave
- 3230 Morcom Ave
- 3238 Morcom Ave
- 3226 Morcom Ave
- 3242 Morcom Ave
- 3222 Morcom Ave
- 3243 Wyman St
- 3237 Wyman St
- 3249 Wyman St
- 3231 Wyman St
- 3216 Morcom Ave
- 3255 Wyman St
- 3225 Wyman St
- 3408 Simmons St
- 3233 Morcom Ave
- 3416 Simmons St
- 3239 Morcom Ave
- 3225 Morcom Ave
- 3219 Wyman St
- 3320 Simmons St
Ask me questions while you tour the home.