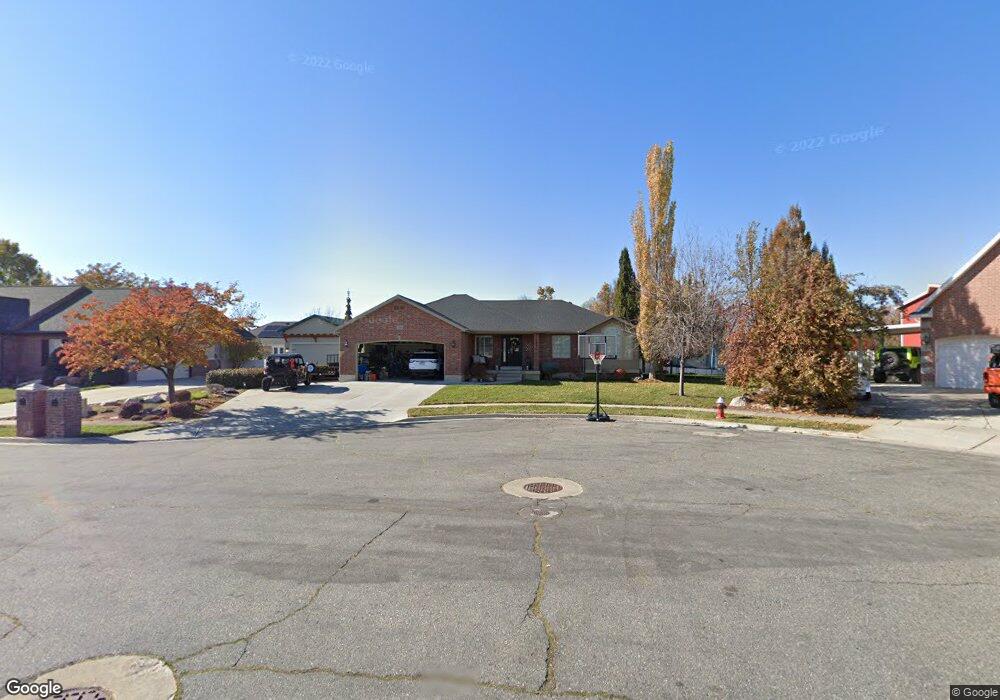
3248 S 750 W Syracuse, UT 84075
Estimated Value: $635,000 - $707,000
4
Beds
4
Baths
1,683
Sq Ft
$398/Sq Ft
Est. Value
About This Home
This home is located at 3248 S 750 W, Syracuse, UT 84075 and is currently estimated at $669,304, approximately $397 per square foot. 3248 S 750 W is a home located in Davis County with nearby schools including Bluff Ridge Elementary, Legacy Junior High School, and Clearfield High School.
Ownership History
Date
Name
Owned For
Owner Type
Purchase Details
Closed on
Nov 30, 2003
Sold by
Bodrero Tyler and Bodrero Annette
Bought by
Bodrero Tyler and Bodrero Annette
Current Estimated Value
Home Financials for this Owner
Home Financials are based on the most recent Mortgage that was taken out on this home.
Original Mortgage
$190,000
Outstanding Balance
$88,329
Interest Rate
6.04%
Mortgage Type
New Conventional
Estimated Equity
$580,975
Purchase Details
Closed on
Nov 3, 2003
Sold by
J & J Produce Inc
Bought by
Bodrero Tyler and Bodrero Annette
Home Financials for this Owner
Home Financials are based on the most recent Mortgage that was taken out on this home.
Original Mortgage
$190,000
Outstanding Balance
$88,329
Interest Rate
6.04%
Mortgage Type
New Conventional
Estimated Equity
$580,975
Purchase Details
Closed on
May 5, 2003
Sold by
Us Development Inc
Bought by
J & J Produce Inc
Create a Home Valuation Report for This Property
The Home Valuation Report is an in-depth analysis detailing your home's value as well as a comparison with similar homes in the area
Home Values in the Area
Average Home Value in this Area
Purchase History
| Date | Buyer | Sale Price | Title Company |
|---|---|---|---|
| Bodrero Tyler | -- | Executive Title Insurance Ag | |
| Bodrero Tyler | -- | Bonneville Title Company Inc | |
| J & J Produce Inc | -- | Bonneville Title Company Inc |
Source: Public Records
Mortgage History
| Date | Status | Borrower | Loan Amount |
|---|---|---|---|
| Open | Bodrero Tyler | $190,000 |
Source: Public Records
Tax History
| Year | Tax Paid | Tax Assessment Tax Assessment Total Assessment is a certain percentage of the fair market value that is determined by local assessors to be the total taxable value of land and additions on the property. | Land | Improvement |
|---|---|---|---|---|
| 2025 | $3,466 | $334,400 | $130,596 | $203,804 |
| 2024 | $3,431 | $333,300 | $107,426 | $225,874 |
| 2023 | $3,243 | $574,000 | $149,719 | $424,281 |
| 2022 | $3,390 | $328,900 | $86,264 | $242,636 |
| 2021 | $2,929 | $440,000 | $127,413 | $312,587 |
| 2020 | $2,634 | $383,000 | $111,285 | $271,715 |
| 2019 | $2,529 | $363,000 | $108,416 | $254,584 |
| 2018 | $2,351 | $335,000 | $104,900 | $230,100 |
| 2016 | $2,150 | $160,655 | $40,276 | $120,379 |
| 2015 | $2,188 | $155,705 | $40,276 | $115,429 |
| 2014 | $2,009 | $145,708 | $40,276 | $105,432 |
| 2013 | -- | $117,967 | $36,655 | $81,312 |
Source: Public Records
Map
Nearby Homes
- 3448 S 550 W
- 3475 S Bluff Rd
- 1282 W 3150 S
- 921 W 2700 S
- 3528 S Finch St
- 34 S 3600 W
- 2766 S 1200 W
- 3348 W 200 N
- 3067 S Old Emigrant Rd Unit B
- 3047 S Old Emigrant Rd
- 101 S 3600 W
- 1137 W 2500 S
- 1407 W Silver Hollow Rd
- 3488 S Sugar Pine Dr
- 1543 W Parkview Dr
- 3535 W Overlook Dr
- 1596 W Parkview Dr
- 1651 W White Pine Dr
- 245 S Summer Breeze Ln
- 2734 S Allison Way Unit 213