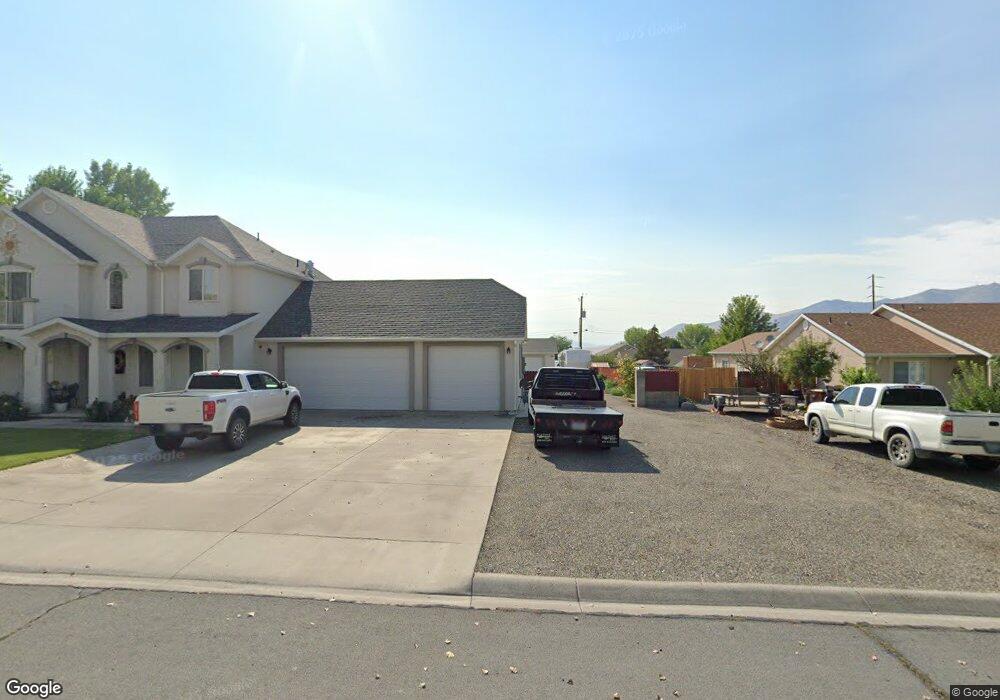
3248 Stuart St Winnemucca, NV 89445
Estimated Value: $511,249 - $610,000
3
Beds
3
Baths
1,972
Sq Ft
$282/Sq Ft
Est. Value
About This Home
This home is located at 3248 Stuart St, Winnemucca, NV 89445 and is currently estimated at $555,312, approximately $281 per square foot. 3248 Stuart St is a home located in Humboldt County with nearby schools including Sonoma Heights Elementary School, French Ford Middle School, and Winnemucca Junior High School.
Ownership History
Date
Name
Owned For
Owner Type
Purchase Details
Closed on
Jun 19, 2005
Sold by
Simpson James T and Simpson Cindy M
Bought by
Magana Jose M and Magana Luz
Current Estimated Value
Home Financials for this Owner
Home Financials are based on the most recent Mortgage that was taken out on this home.
Original Mortgage
$224,200
Outstanding Balance
$114,789
Interest Rate
5.56%
Mortgage Type
Stand Alone First
Estimated Equity
$440,523
Purchase Details
Closed on
Jan 25, 2005
Sold by
Echeverria Construction & Development Co
Bought by
Simpson James T and Simpson Cindy M
Home Financials for this Owner
Home Financials are based on the most recent Mortgage that was taken out on this home.
Original Mortgage
$172,933
Interest Rate
5.12%
Create a Home Valuation Report for This Property
The Home Valuation Report is an in-depth analysis detailing your home's value as well as a comparison with similar homes in the area
Purchase History
| Date | Buyer | Sale Price | Title Company |
|---|---|---|---|
| Magana Jose M | $236,000 | Western Title Company Inc | |
| Simpson James T | $207,994 | First American Title Company |
Source: Public Records
Mortgage History
| Date | Status | Borrower | Loan Amount |
|---|---|---|---|
| Open | Magana Jose M | $224,200 | |
| Previous Owner | Simpson James T | $172,933 |
Source: Public Records
Tax History
| Year | Tax Paid | Tax Assessment Tax Assessment Total Assessment is a certain percentage of the fair market value that is determined by local assessors to be the total taxable value of land and additions on the property. | Land | Improvement |
|---|---|---|---|---|
| 2025 | $3,924 | $116,654 | $20,475 | $96,179 |
| 2024 | $3,748 | $117,980 | $20,475 | $97,505 |
| 2023 | $3,748 | $110,487 | $19,775 | $90,712 |
| 2022 | $3,229 | $98,405 | $19,775 | $78,630 |
| 2021 | $3,214 | $97,940 | $19,775 | $78,165 |
| 2020 | $3,193 | $97,280 | $19,775 | $77,505 |
| 2019 | $3,092 | $94,413 | $19,775 | $74,638 |
| 2018 | $2,955 | $89,773 | $15,575 | $74,198 |
| 2017 | $2,953 | $89,712 | $15,575 | $74,137 |
| 2016 | $3,006 | $91,243 | $15,575 | $75,668 |
| 2015 | $2,890 | $90,436 | $15,575 | $74,861 |
| 2014 | $2,890 | $88,722 | $15,575 | $73,147 |
Source: Public Records
Map
Nearby Homes
- 5600 Kluncy Canyon Rd
- 2990 Stuart St
- 2948 Paiute St
- 3205 N Sherwood Dr
- 5297 Halter Way Unit 9
- 5295 Halter Way Unit 10
- 5293 Halter Way Unit 11
- 5291 Halter Way Unit 12
- 5261 Halter Way Unit 16
- 5288 Halter Way Unit 17
- 5265 Halter Way Unit 14
- 5267 Halter Way Unit 13
- 5286 Halter Way Unit 18
- 5263 Halter Way Unit 15
- 5284 Halter Way Unit 19
- 5282 Halter Way Unit 20
- 5278 Halter Way Unit 21
- 5276 Halter Way Unit 22
- 5274 Halter Way Unit 23
- 5272 Halter Way Unit 24
- 3226 Stuart St
- 3270 Stuart St
- 3227 Paiute St
- 3204 Stuart St
- 3292 Stuart St
- 3249 Paiute St
- 3293 Paiute St
- 5725 Palisade Dr
- 0 Kirkway Dr & Stuart St Unit 190014962
- 2924 Stuart St
- 3190 Stuart St
- 3246 Paiute St
- 3268 Paiute St
- 3224 Paiute St
- 3303 Paiute St
- 3195 Paiute St
- 3202 Paiute St
- 3290 Paiute St
- 3168 Stuart St
- 3316 Stuart St
Your Personal Tour Guide
Ask me questions while you tour the home.