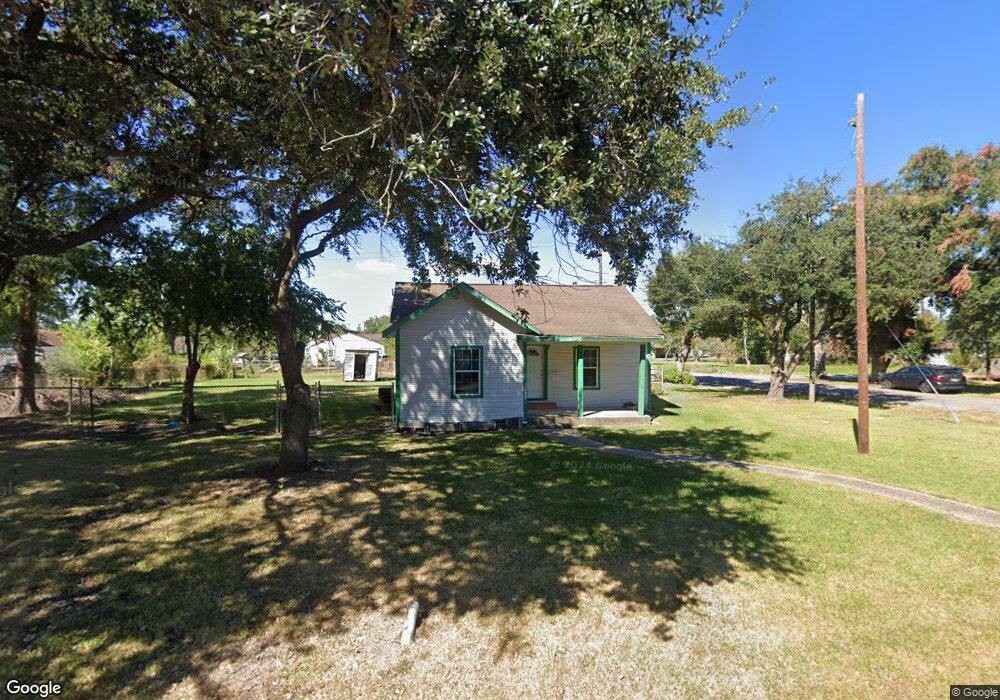
3249 18th St Port Arthur, TX 77642
Estimated Value: $108,000 - $132,091
--
Bed
--
Bath
1,584
Sq Ft
$78/Sq Ft
Est. Value
About This Home
This home is located at 3249 18th St, Port Arthur, TX 77642 and is currently estimated at $124,273, approximately $78 per square foot. 3249 18th St is a home located in Jefferson County with nearby schools including DeQueen Elementary School, Abraham Lincoln Middle School, and Memorial High School.
Ownership History
Date
Name
Owned For
Owner Type
Purchase Details
Closed on
Feb 12, 2025
Sold by
Perez Bello Guillermo and Alvarado Liliana J
Bought by
Vasquez Liliana Jamileth Alv
Current Estimated Value
Purchase Details
Closed on
Oct 24, 2018
Sold by
Mondragon Guillermo
Bought by
Perez Bello Guillermo and Alvarado Liliana J
Home Financials for this Owner
Home Financials are based on the most recent Mortgage that was taken out on this home.
Original Mortgage
$65,000
Interest Rate
4.7%
Mortgage Type
Purchase Money Mortgage
Purchase Details
Closed on
Sep 8, 2010
Sold by
Jones Darcel
Bought by
Mondragon Guillermo
Purchase Details
Closed on
Oct 5, 2007
Sold by
Newton Bertha and Newton L
Bought by
Jones Darcel
Purchase Details
Closed on
Mar 21, 2006
Sold by
Juneau Riley B
Bought by
Newton L J and Newton Bertha
Create a Home Valuation Report for This Property
The Home Valuation Report is an in-depth analysis detailing your home's value as well as a comparison with similar homes in the area
Home Values in the Area
Average Home Value in this Area
Purchase History
| Date | Buyer | Sale Price | Title Company |
|---|---|---|---|
| Vasquez Liliana Jamileth Alv | -- | None Listed On Document | |
| Perez Bello Guillermo | -- | None Available | |
| Mondragon Guillermo | -- | None Available | |
| Jones Darcel | $29,000 | None Available | |
| Newton L J | -- | None Available |
Source: Public Records
Mortgage History
| Date | Status | Borrower | Loan Amount |
|---|---|---|---|
| Previous Owner | Perez Bello Guillermo | $65,000 |
Source: Public Records
Tax History Compared to Growth
Tax History
| Year | Tax Paid | Tax Assessment Tax Assessment Total Assessment is a certain percentage of the fair market value that is determined by local assessors to be the total taxable value of land and additions on the property. | Land | Improvement |
|---|---|---|---|---|
| 2025 | $3,357 | $114,762 | $7,150 | $107,612 |
| 2024 | $3,357 | $117,195 | $2,640 | $114,555 |
| 2023 | $3,357 | $112,139 | $1,056 | $111,083 |
| 2022 | $2,349 | $73,954 | $1,056 | $72,898 |
| 2021 | $1,186 | $35,770 | $1,056 | $34,714 |
| 2020 | $1,083 | $32,680 | $1,056 | $31,624 |
| 2019 | $1,042 | $30,050 | $1,060 | $28,990 |
| 2018 | $1,042 | $32,680 | $1,060 | $31,620 |
| 2017 | $1,013 | $32,680 | $1,060 | $31,620 |
| 2016 | $957 | $32,680 | $1,060 | $31,620 |
| 2015 | $975 | $32,680 | $1,060 | $31,620 |
| 2014 | $975 | $32,680 | $1,060 | $31,620 |
Source: Public Records
Map
Nearby Homes