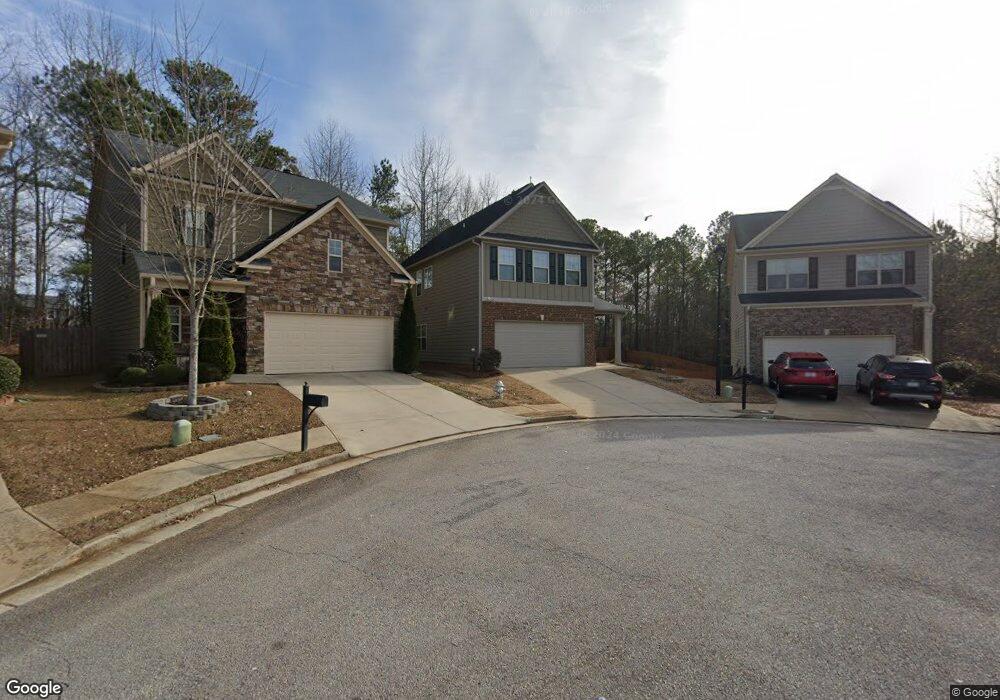
3249 Woodward Down Trail Buford, GA 30519
Estimated Value: $418,000 - $458,000
3
Beds
3
Baths
2,220
Sq Ft
$196/Sq Ft
Est. Value
About This Home
This home is located at 3249 Woodward Down Trail, Buford, GA 30519 and is currently estimated at $434,373, approximately $195 per square foot. 3249 Woodward Down Trail is a home with nearby schools including Patrick Elementary School, Glenn C. Jones Middle School, and Old Suwanee Christian School.
Ownership History
Date
Name
Owned For
Owner Type
Purchase Details
Closed on
Sep 14, 2020
Sold by
Kim Eui Myung
Bought by
Kim Eui Myung and Kim Chun Hui
Current Estimated Value
Home Financials for this Owner
Home Financials are based on the most recent Mortgage that was taken out on this home.
Original Mortgage
$159,000
Outstanding Balance
$140,460
Interest Rate
2.9%
Mortgage Type
New Conventional
Estimated Equity
$293,913
Purchase Details
Closed on
Oct 13, 2016
Sold by
Chun Hui
Bought by
Kim Eui Myung
Home Financials for this Owner
Home Financials are based on the most recent Mortgage that was taken out on this home.
Original Mortgage
$162,500
Interest Rate
3.5%
Mortgage Type
New Conventional
Purchase Details
Closed on
Oct 13, 2015
Sold by
Kim Eui Myung
Bought by
Kim Eui Myung and Kim Chun Hui
Home Financials for this Owner
Home Financials are based on the most recent Mortgage that was taken out on this home.
Original Mortgage
$160,976
Interest Rate
3.93%
Mortgage Type
New Conventional
Purchase Details
Closed on
Apr 24, 2015
Sold by
Highland Falls Llc
Bought by
Sdc Gwinnett Llc
Create a Home Valuation Report for This Property
The Home Valuation Report is an in-depth analysis detailing your home's value as well as a comparison with similar homes in the area
Home Values in the Area
Average Home Value in this Area
Purchase History
| Date | Buyer | Sale Price | Title Company |
|---|---|---|---|
| Kim Eui Myung | -- | -- | |
| Kim Eui Myung | -- | -- | |
| Kim Eui Myung | -- | -- | |
| Kim Eui Myung | $214,635 | -- | |
| Sdc Gwinnett Llc | -- | -- | |
| Highland Falls Llc | $1,880,250 | -- |
Source: Public Records
Mortgage History
| Date | Status | Borrower | Loan Amount |
|---|---|---|---|
| Open | Kim Eui Myung | $159,000 | |
| Previous Owner | Kim Eui Myung | $162,500 | |
| Previous Owner | Kim Eui Myung | $160,976 |
Source: Public Records
Tax History Compared to Growth
Tax History
| Year | Tax Paid | Tax Assessment Tax Assessment Total Assessment is a certain percentage of the fair market value that is determined by local assessors to be the total taxable value of land and additions on the property. | Land | Improvement |
|---|---|---|---|---|
| 2025 | $6,406 | $173,400 | $32,800 | $140,600 |
| 2024 | $1,646 | $168,880 | $34,800 | $134,080 |
| 2023 | $1,646 | $174,840 | $34,800 | $140,040 |
| 2022 | $0 | $152,120 | $26,800 | $125,320 |
| 2021 | $1,598 | $102,080 | $20,320 | $81,760 |
| 2020 | $3,997 | $102,080 | $20,320 | $81,760 |
| 2019 | $3,851 | $102,080 | $20,320 | $81,760 |
| 2018 | $3,524 | $92,640 | $18,000 | $74,640 |
| 2016 | $3,199 | $84,360 | $15,600 | $68,760 |
| 2015 | $513 | $14,040 | $14,040 | $0 |
| 2014 | $166 | $4,240 | $4,240 | $0 |
Source: Public Records
Map
Nearby Homes
- 3367 Greyhawk Crossing
- 1510 Oklahoma Dr
- 2689 Woodward Down Trail NE
- 1785 Plunketts Rd
- 2939 Woodward Down Trail
- 1466 Clarecastle Ln
- 3570 Knoll Crest Trail
- 1320 Newbridge Cir
- 3790 Salvia Dr
- 3641 Deaton Trail
- 2852 Habibi Ct
- 2850 Habibi Ct
- 4152 Adler Cir
- 3962 Adler Cir Unit 7
- 3962 Adler Cir
- 4152 Adler Cir Unit 42
- 4202 Adler Cir Unit 47
- 4202 Adler Cir
- 1781 Plunketts Rd
- 3259 Woodward Down Trail
- 3239 Woodward Down Trail
- 3269 Woodward Down Trail Unit 2929
- 3269 Woodward Down Trail
- 3269 Woodward Down Trail
- 3229 Woodward Down Trail
- 3279 Woodward Down Trail
- 3219 Woodward Down Trail
- 3289 Woodward Down Trail
- 3209 Woodward Down Trail
- 3208 Woodward Down Trail
- 3299 Woodward Down Trail
- 3510 Montana Rd
- 3199 Woodward Down Trail Unit 3199
- 3199 Woodward Down Trail
- 3188 Woodward Down Trail
- 3309 Woodward Down Trail
- 3189 Woodward Down Trail
- 3298 Woodward Down Trail
- 3500 Montana Rd