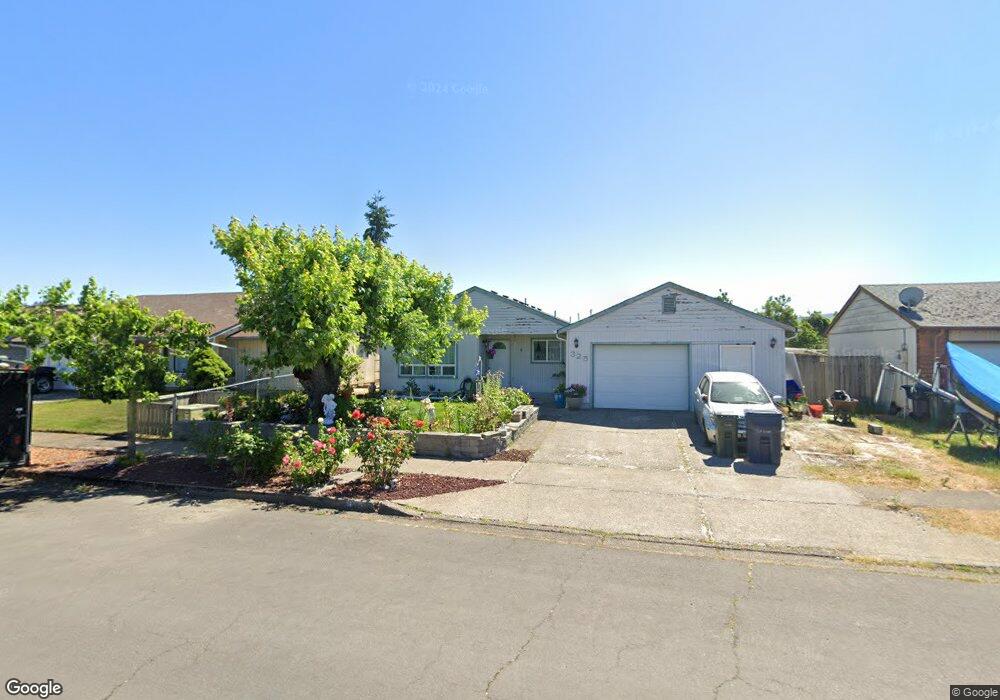
325 38th Place Springfield, OR 97478
East Springfield NeighborhoodEstimated Value: $335,000 - $352,000
3
Beds
1
Bath
1,053
Sq Ft
$328/Sq Ft
Est. Value
About This Home
This home is located at 325 38th Place, Springfield, OR 97478 and is currently estimated at $345,847, approximately $328 per square foot. 325 38th Place is a home located in Lane County with nearby schools including Riverbend Elementary School, Briggs Middle School, and Thurston High School.
Ownership History
Date
Name
Owned For
Owner Type
Purchase Details
Closed on
Nov 8, 2016
Sold by
Allen Deane P and Allen Dianne D
Bought by
Allen Deanne P and Allen Dianne D
Current Estimated Value
Purchase Details
Closed on
Feb 15, 2007
Sold by
Blair Curt A and Blair Melissa A
Bought by
Allen Deane P and Allen Dianne D
Home Financials for this Owner
Home Financials are based on the most recent Mortgage that was taken out on this home.
Original Mortgage
$142,000
Outstanding Balance
$84,764
Interest Rate
6.19%
Mortgage Type
Purchase Money Mortgage
Estimated Equity
$261,083
Create a Home Valuation Report for This Property
The Home Valuation Report is an in-depth analysis detailing your home's value as well as a comparison with similar homes in the area
Home Values in the Area
Average Home Value in this Area
Purchase History
| Date | Buyer | Sale Price | Title Company |
|---|---|---|---|
| Allen Deanne P | -- | None Available | |
| Allen Deane P | $177,500 | Cascade Title Co |
Source: Public Records
Mortgage History
| Date | Status | Borrower | Loan Amount |
|---|---|---|---|
| Open | Allen Deane P | $142,000 |
Source: Public Records
Tax History
| Year | Tax Paid | Tax Assessment Tax Assessment Total Assessment is a certain percentage of the fair market value that is determined by local assessors to be the total taxable value of land and additions on the property. | Land | Improvement |
|---|---|---|---|---|
| 2025 | $2,975 | $162,253 | -- | -- |
| 2024 | $2,927 | $157,528 | -- | -- |
| 2023 | $2,927 | $152,940 | $0 | $0 |
| 2022 | $2,711 | $148,486 | $0 | $0 |
| 2021 | $2,662 | $144,162 | $0 | $0 |
| 2020 | $2,585 | $139,964 | $0 | $0 |
| 2019 | $2,507 | $135,888 | $0 | $0 |
| 2018 | $2,363 | $128,088 | $0 | $0 |
| 2017 | $2,272 | $128,088 | $0 | $0 |
| 2016 | $2,225 | $124,357 | $0 | $0 |
| 2015 | $2,161 | $120,735 | $0 | $0 |
| 2014 | $2,129 | $117,218 | $0 | $0 |
Source: Public Records
Map
Nearby Homes
Your Personal Tour Guide
Ask me questions while you tour the home.