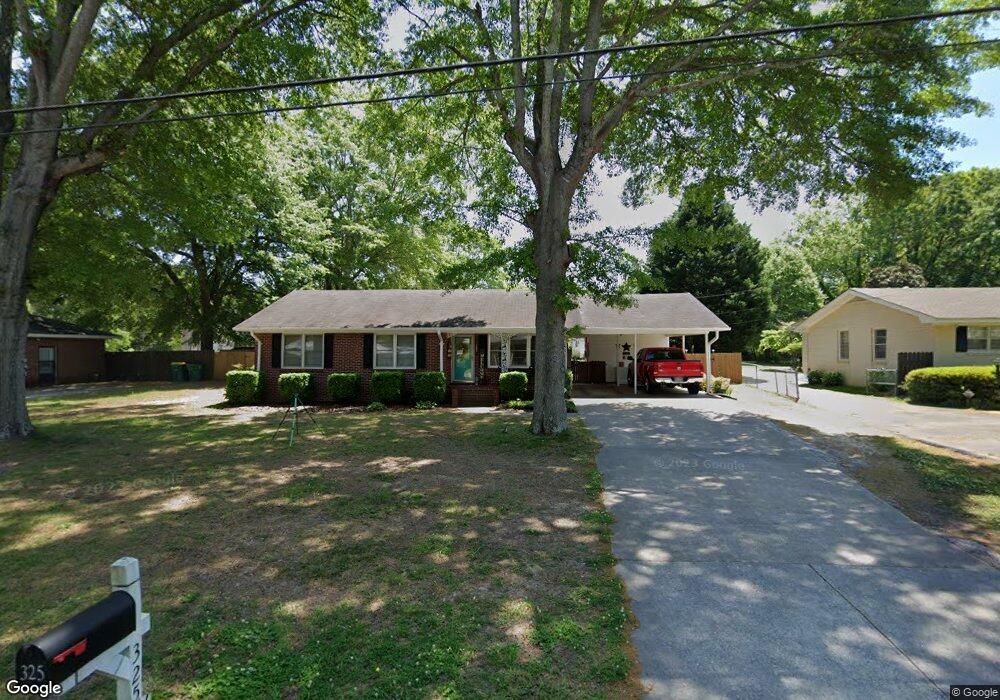
325 3rd Ave Winder, GA 30680
Estimated Value: $264,000 - $283,000
3
Beds
2
Baths
1,238
Sq Ft
$221/Sq Ft
Est. Value
About This Home
This home is located at 325 3rd Ave, Winder, GA 30680 and is currently estimated at $274,030, approximately $221 per square foot. 325 3rd Ave is a home located in Barrow County with nearby schools including County Line Elementary School, Russell Middle School, and Winder-Barrow High School.
Ownership History
Date
Name
Owned For
Owner Type
Purchase Details
Closed on
Mar 1, 2013
Sold by
Moss Timothy D
Bought by
Moss Timothy D and Moss Alishia Ann
Current Estimated Value
Purchase Details
Closed on
Mar 6, 2008
Sold by
Hammond Shannon C
Bought by
Moss Timothy D
Home Financials for this Owner
Home Financials are based on the most recent Mortgage that was taken out on this home.
Original Mortgage
$105,000
Interest Rate
5.46%
Mortgage Type
New Conventional
Purchase Details
Closed on
Aug 31, 2000
Sold by
Green Green F and Green Wendy C
Bought by
Cheney Shannon M
Home Financials for this Owner
Home Financials are based on the most recent Mortgage that was taken out on this home.
Original Mortgage
$71,920
Interest Rate
8.24%
Mortgage Type
New Conventional
Purchase Details
Closed on
Aug 30, 1996
Sold by
Wood Newell
Bought by
Green F Bryan Wendy
Create a Home Valuation Report for This Property
The Home Valuation Report is an in-depth analysis detailing your home's value as well as a comparison with similar homes in the area
Home Values in the Area
Average Home Value in this Area
Purchase History
| Date | Buyer | Sale Price | Title Company |
|---|---|---|---|
| Moss Timothy D | -- | -- | |
| Moss Timothy D | $105,000 | -- | |
| Cheney Shannon M | $89,900 | -- | |
| Green F Bryan Wendy | $62,800 | -- |
Source: Public Records
Mortgage History
| Date | Status | Borrower | Loan Amount |
|---|---|---|---|
| Previous Owner | Moss Timothy D | $105,000 | |
| Previous Owner | Cheney Shannon M | $71,920 | |
| Closed | Green F Bryan Wendy | $0 |
Source: Public Records
Tax History
| Year | Tax Paid | Tax Assessment Tax Assessment Total Assessment is a certain percentage of the fair market value that is determined by local assessors to be the total taxable value of land and additions on the property. | Land | Improvement |
|---|---|---|---|---|
| 2025 | $2,018 | $75,866 | $22,000 | $53,866 |
| 2024 | $2,025 | $74,226 | $22,000 | $52,226 |
| 2023 | $1,543 | $74,226 | $22,000 | $52,226 |
| 2022 | $1,876 | $57,110 | $16,800 | $40,310 |
| 2021 | $1,453 | $43,597 | $12,000 | $31,597 |
| 2020 | $1,399 | $42,352 | $12,000 | $30,352 |
| 2019 | $1,149 | $34,267 | $12,000 | $22,267 |
| 2018 | $1,143 | $34,267 | $12,000 | $22,267 |
| 2017 | $929 | $31,128 | $12,000 | $19,128 |
| 2016 | $926 | $31,128 | $12,000 | $19,128 |
| 2015 | $927 | $31,128 | $12,000 | $19,128 |
| 2014 | $698 | $25,008 | $5,880 | $19,128 |
| 2013 | -- | $24,075 | $5,880 | $18,195 |
Source: Public Records
Map
Nearby Homes
- 352 3rd Ave
- 88 W New St
- 59 W Wright St
- 284 E 5th Ave
- 60 W Williams St
- 253 3rd Ave
- 136 Alexander Ct
- 0 Jerome St Unit 10359679
- 206 E 5th Ave
- 127 N Center St
- 17 W Wright St
- 187 Bellview St
- 10 W Wright St
- 160 N Broad St
- 236 6th Ave
- 5 W Kimball St
- 3 W Kimball St
- 1 W Kimball St
- 303 Rocky Point Ct
- 18 E New St
Your Personal Tour Guide
Ask me questions while you tour the home.