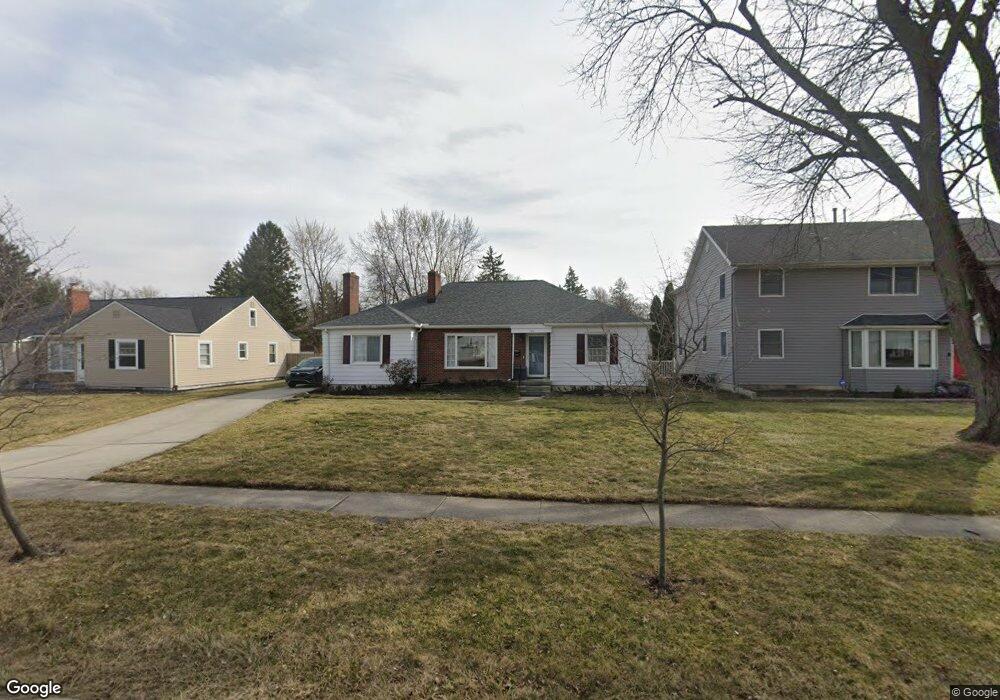
325 7th St Findlay, OH 45840
Estimated Value: $243,000 - $283,000
3
Beds
3
Baths
2,316
Sq Ft
$114/Sq Ft
Est. Value
About This Home
This home is located at 325 7th St, Findlay, OH 45840 and is currently estimated at $264,418, approximately $114 per square foot. 325 7th St is a home located in Hancock County with nearby schools including Jefferson Elementary School, Chamberlin Hill Elementary School, and Donnell Middle School.
Ownership History
Date
Name
Owned For
Owner Type
Purchase Details
Closed on
Dec 11, 2001
Sold by
Mccune David W
Bought by
Blackburn Rodney F and Blackburn Susan K
Current Estimated Value
Home Financials for this Owner
Home Financials are based on the most recent Mortgage that was taken out on this home.
Original Mortgage
$148,900
Outstanding Balance
$58,658
Interest Rate
6.68%
Mortgage Type
New Conventional
Estimated Equity
$205,760
Purchase Details
Closed on
Nov 14, 1996
Sold by
John Francis
Bought by
Mccune David and Mccune Donna
Home Financials for this Owner
Home Financials are based on the most recent Mortgage that was taken out on this home.
Original Mortgage
$109,200
Interest Rate
7%
Mortgage Type
New Conventional
Purchase Details
Closed on
Dec 18, 1991
Bought by
Planas Francis John and Planas Gail
Create a Home Valuation Report for This Property
The Home Valuation Report is an in-depth analysis detailing your home's value as well as a comparison with similar homes in the area
Home Values in the Area
Average Home Value in this Area
Purchase History
| Date | Buyer | Sale Price | Title Company |
|---|---|---|---|
| Blackburn Rodney F | $157,900 | -- | |
| Mccune David | $136,500 | -- | |
| Planas Francis John | $104,000 | -- |
Source: Public Records
Mortgage History
| Date | Status | Borrower | Loan Amount |
|---|---|---|---|
| Open | Blackburn Rodney F | $148,900 | |
| Previous Owner | Mccune David | $109,200 |
Source: Public Records
Tax History Compared to Growth
Tax History
| Year | Tax Paid | Tax Assessment Tax Assessment Total Assessment is a certain percentage of the fair market value that is determined by local assessors to be the total taxable value of land and additions on the property. | Land | Improvement |
|---|---|---|---|---|
| 2024 | $2,351 | $66,170 | $8,230 | $57,940 |
| 2023 | $2,355 | $66,170 | $8,230 | $57,940 |
| 2022 | $2,346 | $66,170 | $8,230 | $57,940 |
| 2021 | $2,336 | $57,390 | $8,240 | $49,150 |
| 2020 | $2,336 | $57,390 | $8,240 | $49,150 |
| 2019 | $2,289 | $57,390 | $8,240 | $49,150 |
| 2018 | $2,012 | $46,240 | $6,590 | $39,650 |
| 2017 | $2,011 | $46,240 | $6,590 | $39,650 |
| 2016 | $1,984 | $46,240 | $6,590 | $39,650 |
| 2015 | $2,387 | $54,590 | $7,690 | $46,900 |
| 2014 | $2,388 | $54,590 | $7,690 | $46,900 |
| 2012 | $2,406 | $54,590 | $7,690 | $46,900 |
Source: Public Records
Map
Nearby Homes
- 211 Fairlawn Place
- 1621 S Main St
- 1727 Washington Ave
- 1705 S Main St
- 123 Glendale Ave
- 200 E Edgar Ave
- 1109 Park St
- 1421 Hurd Ave
- 804 6th St
- 242 E Yates Ave
- 420 1st St
- 1115 Liberty St
- 202 Hancock St
- 1008 Eastview Dr
- 1726 Eastview Dr
- 1011 Stall Dr
- 829 Maple Ave
- 905 S West St
- 1709 Eastview Dr
- 412 Lima Ave