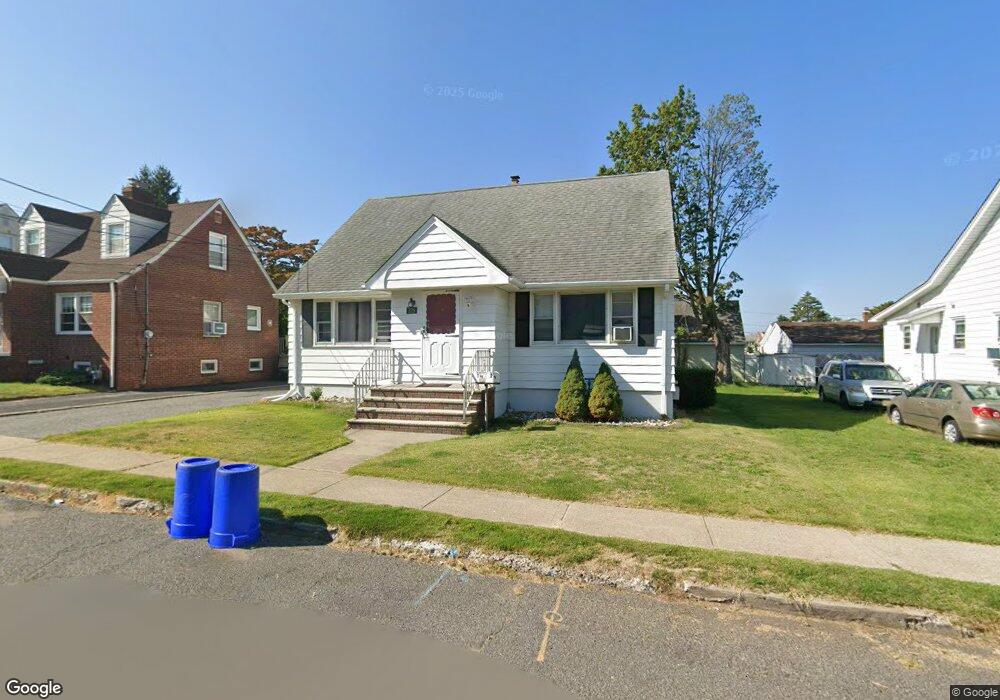
325 8th St Saddle Brook, NJ 07663
Estimated Value: $603,000 - $696,000
1
Bed
1
Bath
1,632
Sq Ft
$396/Sq Ft
Est. Value
About This Home
This home is located at 325 8th St, Saddle Brook, NJ 07663 and is currently estimated at $645,705, approximately $395 per square foot. 325 8th St is a home located in Bergen County with nearby schools including Saddle Brook Mid High School and Bergen Arts and Sciences Charter School.
Ownership History
Date
Name
Owned For
Owner Type
Purchase Details
Closed on
Jul 21, 2016
Sold by
Rochford Richard
Bought by
Sb 325 Lc
Current Estimated Value
Purchase Details
Closed on
Apr 2, 2015
Sold by
Wong Austin
Bought by
Rochford Richard
Purchase Details
Closed on
Dec 28, 2010
Sold by
Marcincin Joseph and Marcincin Elaine
Bought by
Wong Austin
Home Financials for this Owner
Home Financials are based on the most recent Mortgage that was taken out on this home.
Original Mortgage
$290,000
Interest Rate
4.4%
Mortgage Type
Purchase Money Mortgage
Create a Home Valuation Report for This Property
The Home Valuation Report is an in-depth analysis detailing your home's value as well as a comparison with similar homes in the area
Home Values in the Area
Average Home Value in this Area
Purchase History
| Date | Buyer | Sale Price | Title Company |
|---|---|---|---|
| Sb 325 Lc | -- | Westcor Land Title Insurance | |
| Rochford Richard | $365,000 | Westcor Land Title | |
| Wong Austin | $370,000 | -- |
Source: Public Records
Mortgage History
| Date | Status | Borrower | Loan Amount |
|---|---|---|---|
| Previous Owner | Wong Austin | $290,000 |
Source: Public Records
Tax History
| Year | Tax Paid | Tax Assessment Tax Assessment Total Assessment is a certain percentage of the fair market value that is determined by local assessors to be the total taxable value of land and additions on the property. | Land | Improvement |
|---|---|---|---|---|
| 2025 | $9,540 | $425,000 | $225,000 | $200,000 |
| 2024 | $8,629 | $413,700 | $220,000 | $193,700 |
| 2023 | $8,085 | $369,400 | $200,500 | $168,900 |
| 2022 | $8,085 | $336,600 | $175,300 | $161,300 |
| 2021 | $7,822 | $300,400 | $150,600 | $149,800 |
| 2020 | $7,524 | $292,200 | $147,100 | $145,100 |
| 2019 | $7,486 | $288,700 | $144,600 | $144,100 |
| 2018 | $7,324 | $288,700 | $145,600 | $143,100 |
| 2017 | $7,350 | $285,100 | $143,100 | $142,000 |
| 2016 | $7,698 | $268,700 | $133,100 | $135,600 |
| 2015 | $7,295 | $268,700 | $133,100 | $135,600 |
| 2014 | $7,040 | $268,700 | $133,100 | $135,600 |
Source: Public Records
Map
Nearby Homes
- 599 Harrison Ave
- 345 2nd St
- 337 1st St
- 283 Malcolm Ave
- 283 Malcolm Ave Unit 2
- 280 Malcolm Ave
- 152 Claremont Ave
- 363 Macarthur Ave
- 355 Westminster Place
- 374 Semel Ave
- 40 Poplar St
- 29 Poplar St
- 41 Oak St
- 407 van Luyn Terrace
- 54 Bergen St
- 144 Corabelle Ave
- 83 Plauderville Ave
- 45 Arnot St
- 520 Victor St Unit 42
- 520 Victor St Unit 8
Your Personal Tour Guide
Ask me questions while you tour the home.