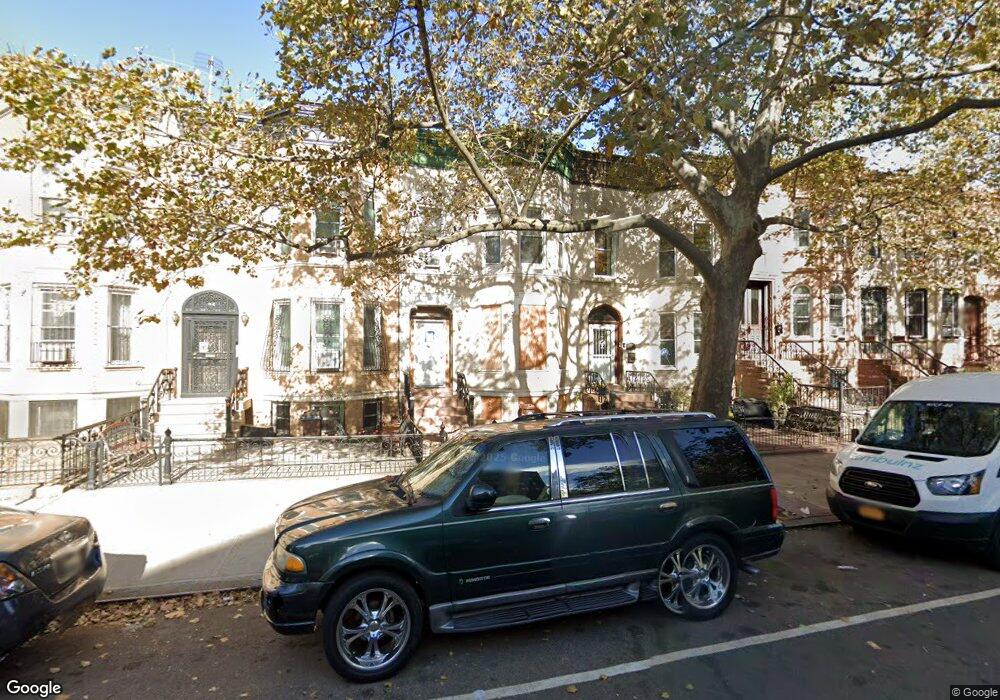
325 Bainbridge St Brooklyn, NY 11233
Bed-Stuy NeighborhoodEstimated Value: $1,278,000 - $1,881,000
5
Beds
2
Baths
2,408
Sq Ft
$695/Sq Ft
Est. Value
About This Home
This home is located at 325 Bainbridge St, Brooklyn, NY 11233 and is currently estimated at $1,673,000, approximately $694 per square foot. 325 Bainbridge St is a home located in Kings County with nearby schools including P.S. 5 Dr Ronald Mcnair, Uncommon Excellence Boys Elementary School and Middle School, and Excellence Girls Charter School.
Ownership History
Date
Name
Owned For
Owner Type
Purchase Details
Closed on
Mar 22, 2018
Sold by
Miller Pamela
Bought by
Newrob Ii Llc
Current Estimated Value
Home Financials for this Owner
Home Financials are based on the most recent Mortgage that was taken out on this home.
Original Mortgage
$305,000
Outstanding Balance
$260,345
Interest Rate
4.4%
Mortgage Type
New Conventional
Estimated Equity
$1,412,655
Purchase Details
Closed on
Dec 28, 2005
Sold by
Davis Leticia and Miller Pamela
Bought by
Miller Pamela
Purchase Details
Closed on
Jun 17, 1997
Sold by
Jackson Anthony and Jackson Denzil
Bought by
Miller Pamela and Davis Leticia
Home Financials for this Owner
Home Financials are based on the most recent Mortgage that was taken out on this home.
Original Mortgage
$107,200
Interest Rate
7.42%
Create a Home Valuation Report for This Property
The Home Valuation Report is an in-depth analysis detailing your home's value as well as a comparison with similar homes in the area
Home Values in the Area
Average Home Value in this Area
Purchase History
| Date | Buyer | Sale Price | Title Company |
|---|---|---|---|
| Newrob Ii Llc | $340,000 | -- | |
| Newrob Ii Llc | $340,000 | -- | |
| Newrob Ii Llc | $340,000 | -- | |
| Miller Pamela | -- | -- | |
| Miller Pamela | -- | -- | |
| Miller Pamela | -- | -- | |
| Miller Pamela | -- | Fidelity National Title Ins | |
| Miller Pamela | -- | Fidelity National Title Ins |
Source: Public Records
Mortgage History
| Date | Status | Borrower | Loan Amount |
|---|---|---|---|
| Open | Newrob Ii Llc | $305,000 | |
| Closed | Newrob Ii Llc | $305,000 | |
| Previous Owner | Miller Pamela | $107,200 | |
| Closed | Miller Pamela | $0 |
Source: Public Records
Tax History
| Year | Tax Paid | Tax Assessment Tax Assessment Total Assessment is a certain percentage of the fair market value that is determined by local assessors to be the total taxable value of land and additions on the property. | Land | Improvement |
|---|---|---|---|---|
| 2025 | $5,517 | $89,220 | $19,260 | $69,960 |
| 2024 | $5,517 | $77,100 | $19,260 | $57,840 |
| 2023 | $5,579 | $78,420 | $19,260 | $59,160 |
| 2022 | $5,442 | $64,200 | $19,260 | $44,940 |
| 2021 | $5,412 | $60,420 | $19,260 | $41,160 |
| 2020 | $5,106 | $73,260 | $19,260 | $54,000 |
| 2019 | $4,789 | $81,000 | $19,260 | $61,740 |
| 2018 | $4,666 | $22,891 | $5,492 | $17,399 |
| 2017 | $4,631 | $22,717 | $7,858 | $14,859 |
| 2016 | $4,284 | $21,432 | $8,546 | $12,886 |
| 2015 | $2,365 | $20,220 | $10,678 | $9,542 |
| 2014 | $2,365 | $19,076 | $12,096 | $6,980 |
Source: Public Records
Map
Nearby Homes
- 497 Decatur St
- 449 Decatur St Unit 3A
- 428 Decatur St
- 521 Decatur St
- 529 Decatur St
- 660 Macon St
- 608 Macdonough St
- 429 Decatur St Unit 3
- 397 Bainbridge St
- 657 Macon St
- 550 Decatur St
- 750 Halsey St
- 768 Halsey St
- 710 Halsey St
- 473 Macdonough St
- 611 Macon St
- 316 Chauncey St Unit MULTIFAM
- 206 Howard Ave
- 806 Halsey St
- 816 Halsey St
- 327 Bainbridge St
- 323 Bainbridge St
- 329 Bainbridge St Unit 1
- 329 Bainbridge St
- 321 Bainbridge St
- 331 Bainbridge St
- 319 Bainbridge St
- 319 Bainbridge St
- 319 Bainbridge St
- 319 Bainbridge St Unit 2
- 333 Bainbridge St
- 317 Bainbridge St
- 317 Bainbridge St Unit B
- 317 Bainbridge St Unit 2
- 317 Bainbridge St Unit 1
- 315 Bainbridge St
- 335 Bainbridge St
- 335 Bainbridge St
- 335 Bainbridge St Unit 2
- 474 Decatur St
Your Personal Tour Guide
Ask me questions while you tour the home.