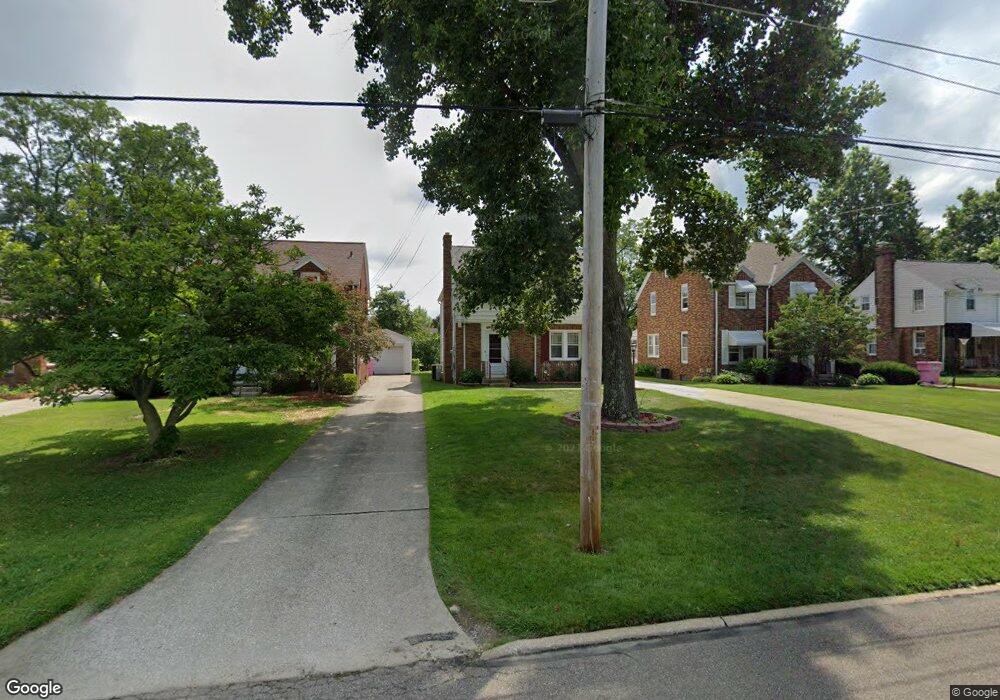
325 Bartley Ave Mansfield, OH 44903
Estimated Value: $136,457 - $164,000
3
Beds
2
Baths
1,736
Sq Ft
$84/Sq Ft
Est. Value
About This Home
This home is located at 325 Bartley Ave, Mansfield, OH 44903 and is currently estimated at $146,614, approximately $84 per square foot. 325 Bartley Ave is a home located in Richland County with nearby schools including Discovery School, St. Peter's Elementary/Montessori School, and St. Peter's Junior High / High School.
Ownership History
Date
Name
Owned For
Owner Type
Purchase Details
Closed on
Dec 2, 2002
Sold by
Swank Suzann
Bought by
Wainwright Lyneal M
Current Estimated Value
Home Financials for this Owner
Home Financials are based on the most recent Mortgage that was taken out on this home.
Original Mortgage
$85,400
Outstanding Balance
$36,631
Interest Rate
6.22%
Mortgage Type
New Conventional
Estimated Equity
$109,984
Purchase Details
Closed on
Jun 2, 1997
Sold by
Cribben Timothy M
Bought by
Terman Suzanne
Home Financials for this Owner
Home Financials are based on the most recent Mortgage that was taken out on this home.
Original Mortgage
$58,400
Interest Rate
5.75%
Mortgage Type
New Conventional
Purchase Details
Closed on
Oct 12, 1993
Sold by
Thompson Ii Richard E
Bought by
Cribben Timothy M
Purchase Details
Closed on
Jan 8, 1990
Purchase Details
Closed on
Mar 1, 1985
Create a Home Valuation Report for This Property
The Home Valuation Report is an in-depth analysis detailing your home's value as well as a comparison with similar homes in the area
Home Values in the Area
Average Home Value in this Area
Purchase History
| Date | Buyer | Sale Price | Title Company |
|---|---|---|---|
| Wainwright Lyneal M | $89,900 | -- | |
| Terman Suzanne | $73,000 | -- | |
| Cribben Timothy M | $59,900 | -- | |
| -- | $61,000 | -- | |
| -- | $52,000 | -- |
Source: Public Records
Mortgage History
| Date | Status | Borrower | Loan Amount |
|---|---|---|---|
| Open | Wainwright Lyneal M | $85,400 | |
| Previous Owner | Terman Suzanne | $58,400 |
Source: Public Records
Tax History
| Year | Tax Paid | Tax Assessment Tax Assessment Total Assessment is a certain percentage of the fair market value that is determined by local assessors to be the total taxable value of land and additions on the property. | Land | Improvement |
|---|---|---|---|---|
| 2024 | $1,090 | $23,810 | $2,960 | $20,850 |
| 2023 | $1,115 | $23,810 | $2,960 | $20,850 |
| 2022 | $914 | $16,350 | $2,400 | $13,950 |
| 2021 | $920 | $16,350 | $2,400 | $13,950 |
| 2020 | $941 | $16,350 | $2,400 | $13,950 |
| 2019 | $1,042 | $16,350 | $2,400 | $13,950 |
| 2018 | $1,028 | $16,350 | $2,400 | $13,950 |
| 2017 | $1,336 | $16,350 | $2,400 | $13,950 |
| 2016 | $1,671 | $26,480 | $3,200 | $23,280 |
| 2015 | $1,596 | $26,480 | $3,200 | $23,280 |
| 2014 | $1,575 | $26,480 | $3,200 | $23,280 |
| 2012 | $632 | $27,860 | $3,360 | $24,500 |
Source: Public Records
Map
Nearby Homes
- 282 Vennum Ave
- 487 Davey Ave
- 455 Marion Ave
- 616 Cline Ave
- 158 Vennum Ave
- 189 Westwood Ave
- 310 Townview Cir N
- 341 Townview Cir N
- 133 Stewart Ave S
- 679 Coleman Rd
- 119 Carpenter Rd
- 116 Stewart Ave S
- 108 Stewart Ave S
- 135 Wood St
- 0 Cline Ave Hedeen Abbeyfeale Unit 9066362
- 151 Grover St
- 31 Bartley Ave
- 30 Douglas Ave
- 456 Lexington Ave
- 131 Sturges Ave
- 331 Bartley Ave
- 321 Bartley Ave
- 335 Bartley Ave
- 313 Bartley Ave
- 339 Bartley Ave
- 326 Poplar St
- 330 Poplar St
- 322 Poplar St
- 318 Poplar St
- 334 Poplar St
- 307 Bartley Ave
- 317 Bartley Ave
- 343 Bartley Ave
- 312 Poplar St
- 312 -314 Poplar St
- 334 Bartley Ave
- 338 Poplar St
- 326 Bartley Ave
- 320 Bartley Ave
- 303 Bartley Ave
Your Personal Tour Guide
Ask me questions while you tour the home.