Estimated Value: $331,000 - $379,000
3
Beds
3
Baths
1,697
Sq Ft
$210/Sq Ft
Est. Value
About This Home
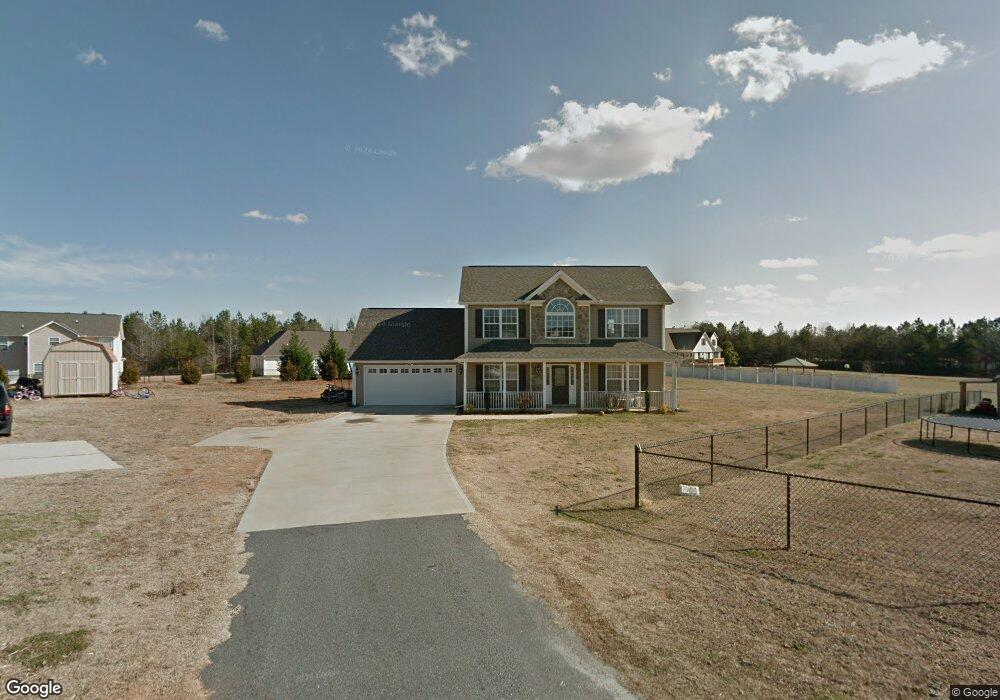
This home is located at 325 Caxton Farms Ct, Inman, SC 29349 and is currently estimated at $356,154, approximately $209 per square foot. 325 Caxton Farms Ct is a home located in Spartanburg County with nearby schools including Inman Elementary School, T.E. Mabry Middle School, and Chapman High School.
Ownership History
Date
Name
Owned For
Owner Type
Purchase Details
Closed on
Feb 28, 2022
Sold by
Bonds Gerald L
Bought by
Campbell Travis and Campbell Kristen
Current Estimated Value
Home Financials for this Owner
Home Financials are based on the most recent Mortgage that was taken out on this home.
Original Mortgage
$279,303
Outstanding Balance
$259,790
Interest Rate
3.69%
Mortgage Type
FHA
Estimated Equity
$96,364
Purchase Details
Closed on
Mar 11, 2010
Sold by
Ashmore Homes Inc
Bought by
Bonds Gerald L and Bonds Tareyta
Home Financials for this Owner
Home Financials are based on the most recent Mortgage that was taken out on this home.
Original Mortgage
$147,696
Interest Rate
4.97%
Mortgage Type
New Conventional
Purchase Details
Closed on
Oct 13, 2009
Sold by
Ashmore Homes Of Greer Inc
Bought by
Ashmore Homes Inc
Home Financials for this Owner
Home Financials are based on the most recent Mortgage that was taken out on this home.
Original Mortgage
$103,200
Interest Rate
5.04%
Mortgage Type
Construction
Create a Home Valuation Report for This Property
The Home Valuation Report is an in-depth analysis detailing your home's value as well as a comparison with similar homes in the area
Home Values in the Area
Average Home Value in this Area
Purchase History
| Date | Buyer | Sale Price | Title Company |
|---|---|---|---|
| Campbell Travis | $305,000 | None Listed On Document | |
| Campbell Travis | $305,000 | None Listed On Document | |
| Bonds Gerald L | $144,800 | -- | |
| Ashmore Homes Inc | -- | -- |
Source: Public Records
Mortgage History
| Date | Status | Borrower | Loan Amount |
|---|---|---|---|
| Open | Campbell Travis | $279,303 | |
| Previous Owner | Bonds Gerald L | $147,696 | |
| Previous Owner | Ashmore Homes Inc | $103,200 |
Source: Public Records
Tax History Compared to Growth
Tax History
| Year | Tax Paid | Tax Assessment Tax Assessment Total Assessment is a certain percentage of the fair market value that is determined by local assessors to be the total taxable value of land and additions on the property. | Land | Improvement |
|---|---|---|---|---|
| 2025 | $2,281 | $12,200 | $2,188 | $10,012 |
| 2024 | $2,281 | $12,200 | $2,188 | $10,012 |
| 2023 | $2,281 | $12,200 | $2,188 | $10,012 |
| 2022 | $1,242 | $6,564 | $907 | $5,657 |
| 2021 | $1,242 | $6,564 | $907 | $5,657 |
| 2020 | $1,221 | $6,564 | $907 | $5,657 |
| 2019 | $1,221 | $6,564 | $907 | $5,657 |
| 2018 | $1,221 | $6,564 | $907 | $5,657 |
| 2017 | $998 | $5,228 | $1,000 | $4,228 |
| 2016 | $998 | $5,228 | $1,000 | $4,228 |
| 2015 | $975 | $5,228 | $1,000 | $4,228 |
| 2014 | $970 | $5,228 | $1,000 | $4,228 |
Source: Public Records
Map
Nearby Homes
- 490 Hickory Nut Rd
- 1620 Bishop Rd
- 655 Autumn Breeze Walk
- 630 Claystone Dr
- 2027 Blessed Dr
- 2033 Blessed Dr
- 2056 Blessed Dr
- 345 Bishop Hicks Ct
- 2032 Blessed Dr
- 2062 Blessed Dr
- Middleton Plan at Walnut Ridge
- Parker Plan at Walnut Ridge
- Cameron Plan at Walnut Ridge
- Drayton Plan at Walnut Ridge
- Cooper 3 Plan at Walnut Ridge
- Augusta Plan at Walnut Ridge
- Finley Plan at Walnut Ridge
- 3033 Harvey Brook Ct
- 14071 Satinwood Way
- 14017 Satinwood Way
- 325 Caxton Farm Ct
- 329 Caxton Farms Ct
- 321 Caxton Farms Ct
- 709 Pen Del Rd
- 333 Caxton Farms Ct
- 333 Caxton Farm Ct
- 703 Pen Del Rd
- 715 Pen Del Rd
- 317 Caxton Farms Ct
- 719 Pen Del Rd
- 309 Caxton Farms Ct
- 326 Caxton Farms Ct
- 330 Caxton Farms Ct
- 318 Caxton Farms Ct
- 725 Pen Del Rd
- 322 Caxton Farms Ct
- 305 Caxton Farms Ct
- 305 Caxton Farms Ct
- 19 Mitchell Farm Rd
- 23 Mitchell Farm Rd