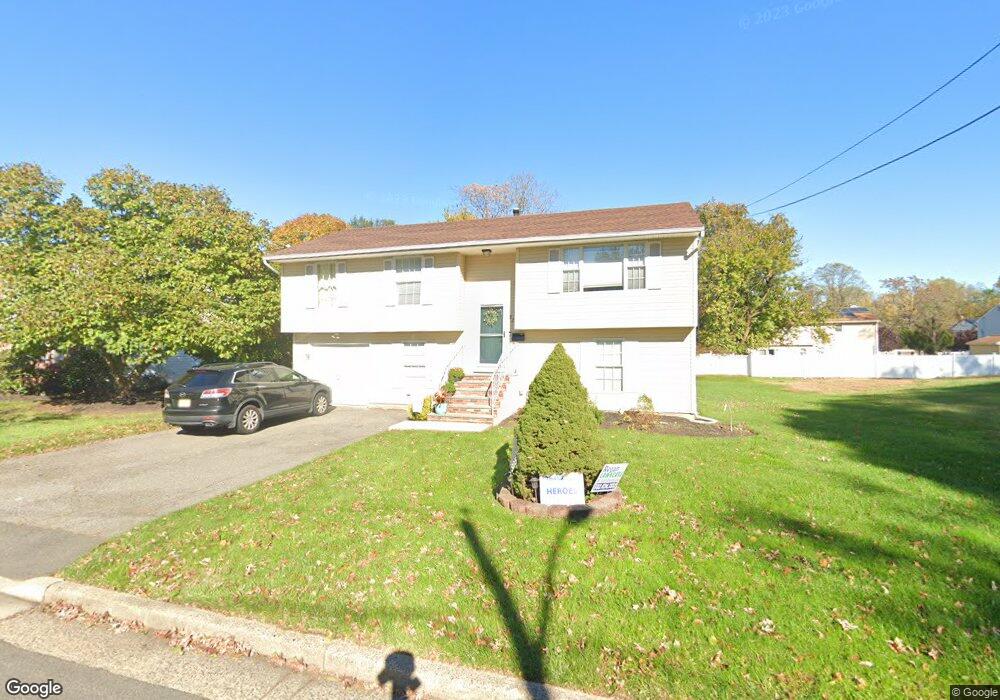
325 Chestnut Place Piscataway, NJ 08854
Estimated Value: $632,996 - $763,000
5
Beds
2
Baths
1,988
Sq Ft
$343/Sq Ft
Est. Value
About This Home
This home is located at 325 Chestnut Place, Piscataway, NJ 08854 and is currently estimated at $682,499, approximately $343 per square foot. 325 Chestnut Place is a home located in Middlesex County with nearby schools including Arbor Intermediate School, Dwight D. Eisenhower School, and Quibbletown Middle School.
Ownership History
Date
Name
Owned For
Owner Type
Purchase Details
Closed on
Dec 22, 2015
Sold by
Sask Holdings Llc
Bought by
Hall Jasmine R
Current Estimated Value
Home Financials for this Owner
Home Financials are based on the most recent Mortgage that was taken out on this home.
Original Mortgage
$315,875
Outstanding Balance
$250,633
Interest Rate
3.97%
Mortgage Type
New Conventional
Estimated Equity
$431,866
Purchase Details
Closed on
Mar 31, 2000
Sold by
Holmes Thomas
Bought by
Semambya Mary
Home Financials for this Owner
Home Financials are based on the most recent Mortgage that was taken out on this home.
Original Mortgage
$146,850
Interest Rate
8.3%
Purchase Details
Closed on
Jul 26, 1996
Sold by
Owens John
Bought by
Holmes Thomas
Home Financials for this Owner
Home Financials are based on the most recent Mortgage that was taken out on this home.
Original Mortgage
$144,000
Interest Rate
8.27%
Mortgage Type
FHA
Create a Home Valuation Report for This Property
The Home Valuation Report is an in-depth analysis detailing your home's value as well as a comparison with similar homes in the area
Home Values in the Area
Average Home Value in this Area
Purchase History
| Date | Buyer | Sale Price | Title Company |
|---|---|---|---|
| Hall Jasmine R | $332,500 | Elite Team Title Llc | |
| Semambya Mary | $147,000 | -- | |
| Holmes Thomas | $146,000 | -- |
Source: Public Records
Mortgage History
| Date | Status | Borrower | Loan Amount |
|---|---|---|---|
| Open | Hall Jasmine R | $315,875 | |
| Previous Owner | Semambya Mary | $146,850 | |
| Previous Owner | Holmes Thomas | $144,000 |
Source: Public Records
Tax History Compared to Growth
Tax History
| Year | Tax Paid | Tax Assessment Tax Assessment Total Assessment is a certain percentage of the fair market value that is determined by local assessors to be the total taxable value of land and additions on the property. | Land | Improvement |
|---|---|---|---|---|
| 2025 | $8,013 | $504,900 | $226,500 | $278,400 |
| 2024 | $7,704 | $410,300 | $146,100 | $264,200 |
| 2023 | $7,704 | $368,600 | $146,100 | $222,500 |
| 2022 | $7,487 | $332,600 | $146,100 | $186,500 |
| 2021 | $6,965 | $297,400 | $146,100 | $151,300 |
| 2020 | $6,716 | $287,500 | $116,100 | $171,400 |
| 2019 | $6,837 | $287,500 | $116,100 | $171,400 |
| 2018 | $6,085 | $256,100 | $116,100 | $140,000 |
| 2017 | $6,688 | $243,200 | $96,100 | $147,100 |
| 2016 | $5,793 | $214,800 | $96,100 | $118,700 |
| 2015 | $5,714 | $214,800 | $96,100 | $118,700 |
| 2014 | $5,585 | $214,800 | $96,100 | $118,700 |
Source: Public Records
Map
Nearby Homes
- 304 Chestnut Place
- 324 Rock Ave
- 1758 S 2nd St
- 1762 S 2nd St
- 1718 W 4th St
- 405 Wall St
- 115 Jefferson Ave
- 233 Maple Ave
- 118 Jadach Dr
- 1565 W 6th St
- 30 Everett Place
- 1357-1403 S 2nd St Unit 2
- 1357-1403 S 2nd St
- 203 S Washington Ave
- 1724 Quincy St
- 1620 Quincy St
- 525 Pleasant Ave
- 1408 W 5th St
- 143 1st St
- 203 Walnut St
- 323 Chestnut Place
- 310 Oak Place
- 307 Chestnut Place
- 312 Oak Place
- 308 Oak Place
- 320 Chestnut Place
- 331 Chestnut Place
- 310 Chestnut Place
- 306 Chestnut Place
- 304 Oak Place
- 314 Oak Place
- 1719 W 3rd St
- 1723 W 3rd St
- 324 Chestnut Place
- 1715 W 3rd St
- 335 Chestnut Place
- 305 Poplar Place
- 1711 W 3rd St
- 1727 W 3rd St
- 328 Chestnut Place