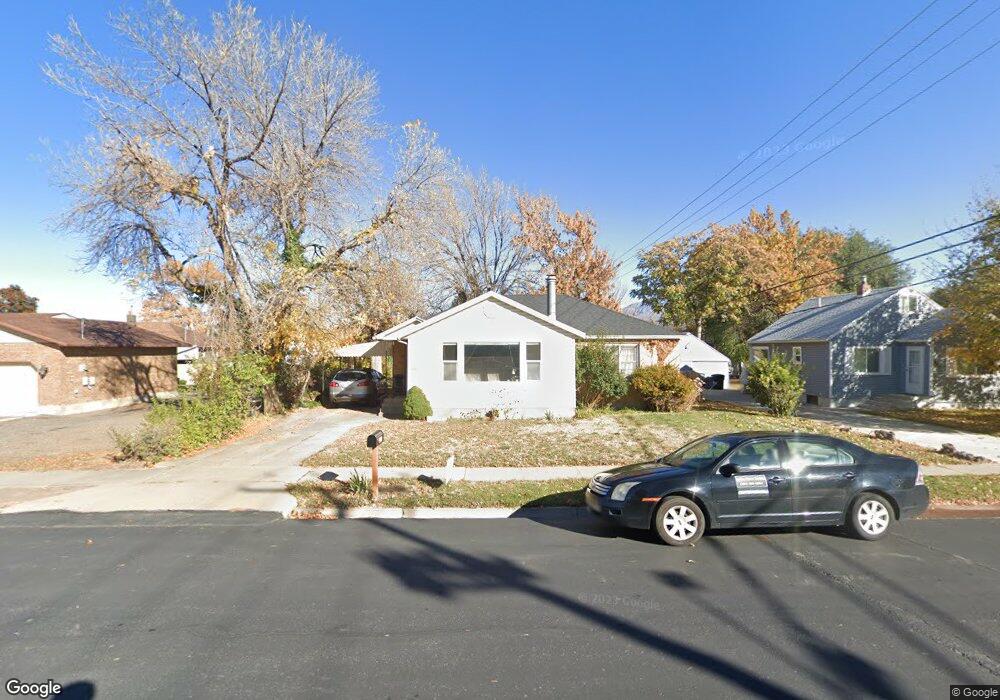
325 E 100 S Spanish Fork, UT 84660
Estimated Value: $381,000 - $431,000
3
Beds
2
Baths
2,129
Sq Ft
$190/Sq Ft
Est. Value
About This Home
This home is located at 325 E 100 S, Spanish Fork, UT 84660 and is currently estimated at $403,571, approximately $189 per square foot. 325 E 100 S is a home located in Utah County with nearby schools including Park Elementary School, Spanish Fork Jr High School, and Spanish Fork High School.
Ownership History
Date
Name
Owned For
Owner Type
Purchase Details
Closed on
May 19, 2023
Sold by
Maltba Hannah and Maltba Jared
Bought by
Maltba Jared and Maltba Hannah
Current Estimated Value
Home Financials for this Owner
Home Financials are based on the most recent Mortgage that was taken out on this home.
Original Mortgage
$290,300
Outstanding Balance
$282,050
Interest Rate
6.27%
Mortgage Type
New Conventional
Estimated Equity
$121,521
Purchase Details
Closed on
Nov 21, 2022
Sold by
Leifson Family Irrevocable Property Trus
Bought by
Maltba Hannah and Maltba Jared
Home Financials for this Owner
Home Financials are based on the most recent Mortgage that was taken out on this home.
Original Mortgage
$280,000
Interest Rate
7.08%
Mortgage Type
New Conventional
Purchase Details
Closed on
Feb 26, 2014
Sold by
Leifson Mary Lou
Bought by
Wilde Karen
Create a Home Valuation Report for This Property
The Home Valuation Report is an in-depth analysis detailing your home's value as well as a comparison with similar homes in the area
Home Values in the Area
Average Home Value in this Area
Purchase History
| Date | Buyer | Sale Price | Title Company |
|---|---|---|---|
| Maltba Jared | -- | Title Guarantee | |
| Maltba Hannah | -- | Old Republic Title | |
| Wilde Karen | -- | None Available |
Source: Public Records
Mortgage History
| Date | Status | Borrower | Loan Amount |
|---|---|---|---|
| Open | Maltba Jared | $290,300 | |
| Previous Owner | Maltba Hannah | $280,000 |
Source: Public Records
Tax History
| Year | Tax Paid | Tax Assessment Tax Assessment Total Assessment is a certain percentage of the fair market value that is determined by local assessors to be the total taxable value of land and additions on the property. | Land | Improvement |
|---|---|---|---|---|
| 2025 | $1,782 | $207,570 | -- | -- |
| 2024 | $1,782 | $183,700 | $0 | $0 |
| 2023 | $1,768 | $182,435 | $0 | $0 |
| 2022 | $1,982 | $200,585 | $0 | $0 |
| 2021 | $1,737 | $281,300 | $79,100 | $202,200 |
| 2020 | $1,576 | $248,100 | $65,900 | $182,200 |
| 2019 | $1,354 | $224,300 | $65,900 | $158,400 |
| 2018 | $1,272 | $203,600 | $65,900 | $137,700 |
| 2017 | $1,128 | $97,075 | $0 | $0 |
| 2016 | $1,011 | $85,855 | $0 | $0 |
| 2015 | $961 | $80,630 | $0 | $0 |
| 2014 | $877 | $73,865 | $0 | $0 |
Source: Public Records
Map
Nearby Homes
- 844 S 200 E Unit 4-304
- 844 S 200 E Unit 4 -201
- 390 S 300 E
- 573 E 300 S
- 284 N 400 E
- 270 N 500 E
- 298 S St Unit 205
- 296 S St Unit 20
- 2583 E 300 S Unit 21
- 324 S St Unit 204
- 440 N 200 E
- 265 N 800 E
- 679 E 400 N
- 973 E 60 S
- 570 N 100 E
- 294 W 200 N
- 330 E 700 N
- 837 S 200 E Unit 5-303
- 837 S 200 E Unit 5-201
- 837 S 200 E Unit 5-301
Your Personal Tour Guide
Ask me questions while you tour the home.