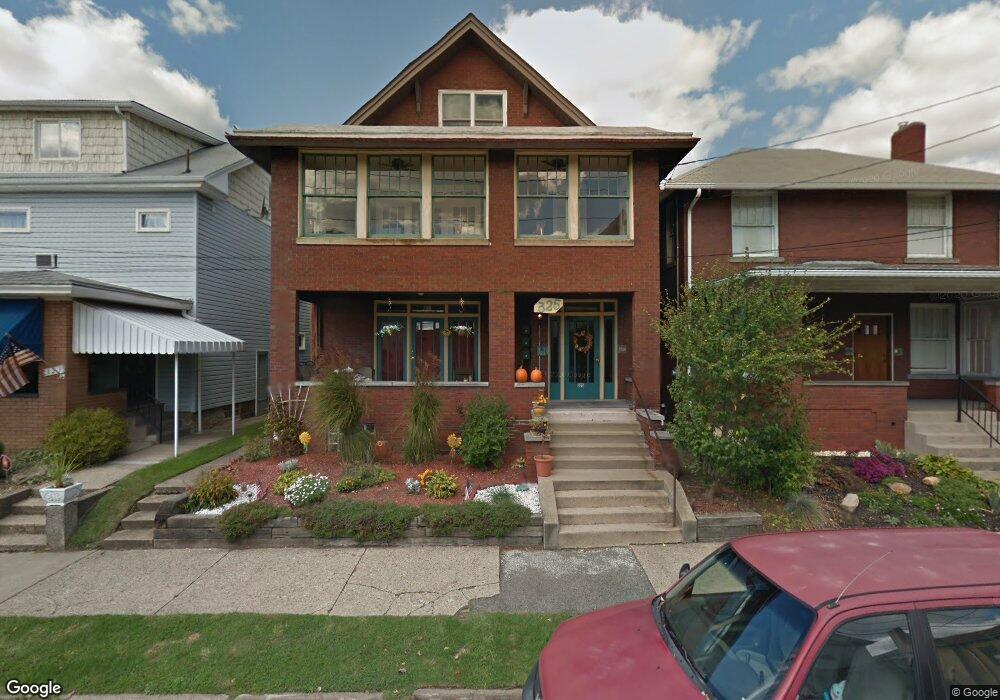
325 E 9th Ave Tarentum, PA 15084
Estimated Value: $115,000 - $142,031
5
Beds
3
Baths
2,128
Sq Ft
$61/Sq Ft
Est. Value
About This Home
This home is located at 325 E 9th Ave, Tarentum, PA 15084 and is currently estimated at $130,008, approximately $61 per square foot. 325 E 9th Ave is a home located in Allegheny County with nearby schools including Highlands Senior High School, Mary Queen of Apostles School, and St. Joseph High School.
Ownership History
Date
Name
Owned For
Owner Type
Purchase Details
Closed on
Sep 3, 2024
Sold by
Curry David and Curry Nancy
Bought by
Harold Nicole C and Michalski Nash A
Current Estimated Value
Home Financials for this Owner
Home Financials are based on the most recent Mortgage that was taken out on this home.
Original Mortgage
$101,250
Outstanding Balance
$100,175
Interest Rate
6.77%
Mortgage Type
New Conventional
Estimated Equity
$29,833
Purchase Details
Closed on
Aug 26, 2024
Sold by
Curry David and Curry Nancy
Bought by
Michalski Nash A
Home Financials for this Owner
Home Financials are based on the most recent Mortgage that was taken out on this home.
Original Mortgage
$101,250
Outstanding Balance
$100,175
Interest Rate
6.77%
Mortgage Type
New Conventional
Estimated Equity
$29,833
Purchase Details
Closed on
May 29, 2009
Sold by
Darmer Daniel H
Bought by
Curry David
Purchase Details
Closed on
Feb 10, 1994
Sold by
Boroto Lois R
Bought by
Garmer Daniel H
Create a Home Valuation Report for This Property
The Home Valuation Report is an in-depth analysis detailing your home's value as well as a comparison with similar homes in the area
Home Values in the Area
Average Home Value in this Area
Purchase History
| Date | Buyer | Sale Price | Title Company |
|---|---|---|---|
| Harold Nicole C | $135,000 | -- | |
| Harold Nicole C | $135,000 | -- | |
| Michalski Nash A | $135,000 | -- | |
| Curry David | $79,000 | -- | |
| Garmer Daniel H | $57,000 | -- |
Source: Public Records
Mortgage History
| Date | Status | Borrower | Loan Amount |
|---|---|---|---|
| Open | Harold Nicole C | $101,250 | |
| Closed | Harold Nicole C | $101,250 |
Source: Public Records
Tax History
| Year | Tax Paid | Tax Assessment Tax Assessment Total Assessment is a certain percentage of the fair market value that is determined by local assessors to be the total taxable value of land and additions on the property. | Land | Improvement |
|---|---|---|---|---|
| 2025 | $2,626 | $74,300 | $18,000 | $56,300 |
| 2024 | $2,626 | $74,300 | $18,000 | $56,300 |
| 2023 | $2,626 | $74,300 | $18,000 | $56,300 |
| 2022 | $2,607 | $74,300 | $18,000 | $56,300 |
| 2021 | $351 | $74,300 | $18,000 | $56,300 |
| 2020 | $2,607 | $74,300 | $18,000 | $56,300 |
| 2019 | $2,589 | $74,300 | $18,000 | $56,300 |
| 2018 | $351 | $74,300 | $18,000 | $56,300 |
| 2017 | $2,527 | $74,300 | $18,000 | $56,300 |
| 2016 | $351 | $74,300 | $18,000 | $56,300 |
| 2015 | $351 | $74,300 | $18,000 | $56,300 |
| 2014 | $2,527 | $74,300 | $18,000 | $56,300 |
Source: Public Records
Map
Nearby Homes
Your Personal Tour Guide
Ask me questions while you tour the home.