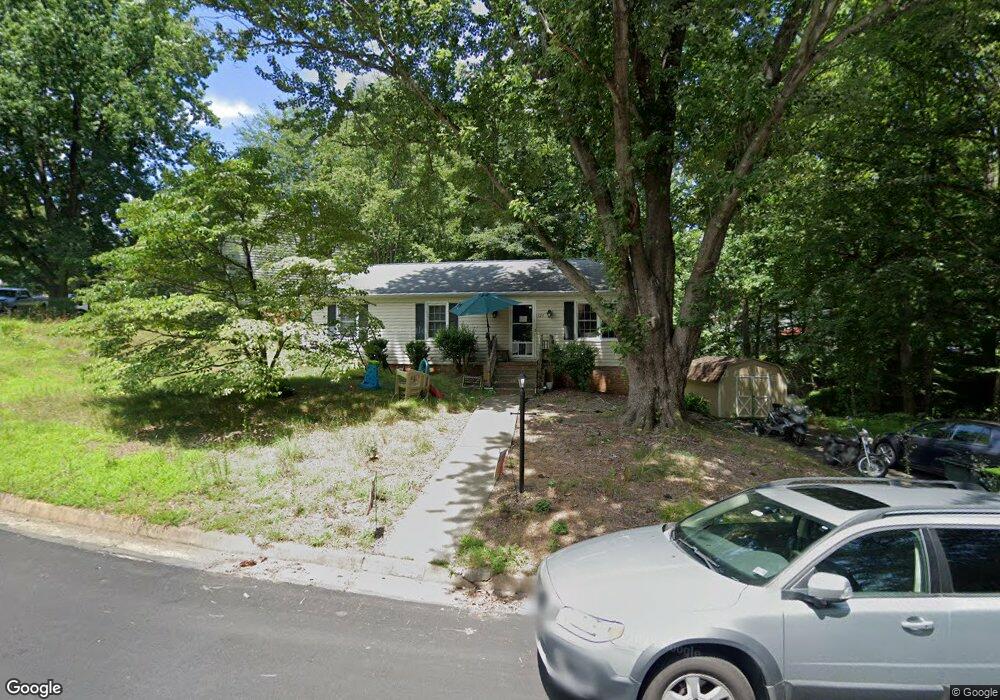
325 Eastbrook Dr Charlottesville, VA 22901
Estimated Value: $402,000 - $458,575
4
Beds
3
Baths
2,229
Sq Ft
$197/Sq Ft
Est. Value
About This Home
This home is located at 325 Eastbrook Dr, Charlottesville, VA 22901 and is currently estimated at $438,644, approximately $196 per square foot. 325 Eastbrook Dr is a home located in Albemarle County with nearby schools including Woodbrook Elementary School, Journey Middle School, and Albemarle High School.
Ownership History
Date
Name
Owned For
Owner Type
Purchase Details
Closed on
Mar 30, 2018
Bought by
Secor Kathleen
Current Estimated Value
Home Financials for this Owner
Home Financials are based on the most recent Mortgage that was taken out on this home.
Original Mortgage
$232,200
Outstanding Balance
$199,688
Interest Rate
4.44%
Estimated Equity
$238,956
Purchase Details
Closed on
Dec 28, 2009
Sold by
Hatcher Timothy M
Bought by
Meadors David C and Meadors Carrie K
Home Financials for this Owner
Home Financials are based on the most recent Mortgage that was taken out on this home.
Original Mortgage
$223,870
Interest Rate
5.5%
Mortgage Type
FHA
Purchase Details
Closed on
Jan 17, 2007
Sold by
Hatcher John M and Hatcher Gladys F
Bought by
Hatcher John M and Hatcher Gladys F
Create a Home Valuation Report for This Property
The Home Valuation Report is an in-depth analysis detailing your home's value as well as a comparison with similar homes in the area
Home Values in the Area
Average Home Value in this Area
Purchase History
| Date | Buyer | Sale Price | Title Company |
|---|---|---|---|
| Secor Kathleen | $258,000 | -- | |
| Meadors David C | $228,000 | -- | |
| Hatcher John M | -- | -- |
Source: Public Records
Mortgage History
| Date | Status | Borrower | Loan Amount |
|---|---|---|---|
| Open | Secor Kathleen | $232,200 | |
| Closed | Secor Kathleen | -- | |
| Previous Owner | Meadors David C | $223,870 |
Source: Public Records
Tax History Compared to Growth
Tax History
| Year | Tax Paid | Tax Assessment Tax Assessment Total Assessment is a certain percentage of the fair market value that is determined by local assessors to be the total taxable value of land and additions on the property. | Land | Improvement |
|---|---|---|---|---|
| 2025 | $3,375 | $377,500 | $110,400 | $267,100 |
| 2024 | -- | $357,000 | $110,400 | $246,600 |
| 2023 | $3,154 | $369,300 | $110,400 | $258,900 |
| 2022 | $2,910 | $340,700 | $110,400 | $230,300 |
| 2021 | $2,594 | $303,800 | $110,400 | $193,400 |
| 2020 | $2,388 | $279,600 | $110,400 | $169,200 |
| 2019 | $2,334 | $273,300 | $110,400 | $162,900 |
| 2018 | $2,222 | $267,200 | $110,400 | $156,800 |
| 2017 | $2,202 | $262,500 | $81,600 | $180,900 |
| 2016 | $1,896 | $226,000 | $81,600 | $144,400 |
| 2015 | $910 | $222,200 | $81,600 | $140,600 |
| 2014 | -- | $214,000 | $81,600 | $132,400 |
Source: Public Records
Map
Nearby Homes
- 315 Brentwood Rd
- 307 Eastbrook Dr
- 1704 Old Brook Rd
- 1704 Old Brook Rd Unit 1700
- 1712 Hearthglow Ln
- 2904 Brookmere Rd
- 1131 Raintree Dr
- 1197 Raintree Dr
- 329 Carrsbrook Dr
- 2515 Northfield Rd
- 2608 Northfield Rd
- 224 Carrsbrook Dr
- 330 Carrsbrook Dr
- 311 Gloucester Rd
- 3511 Marlboro Ct
- 997 Glenwood Station Ln
- 323 Eastbrook Dr
- 321 Eastbrook Dr
- 409 Eastbrook Dr
- 408 Eastbrook Dr
- 410 Eastbrook Dr
- 406 Eastbrook Dr
- 312 Parkwood Place
- 319 Eastbrook Dr
- 332 Brentwood Rd
- 404 Eastbrook Dr
- 402 Eastbrook Dr
- 412 Eastbrook Dr
- 331 Brentwood Rd
- 310 Parkwood Place
- 317 Eastbrook Dr
- 329 Brentwood Rd
- 330 Brentwood Rd
- 414 Eastbrook Dr
- 501 Eastbrook Dr