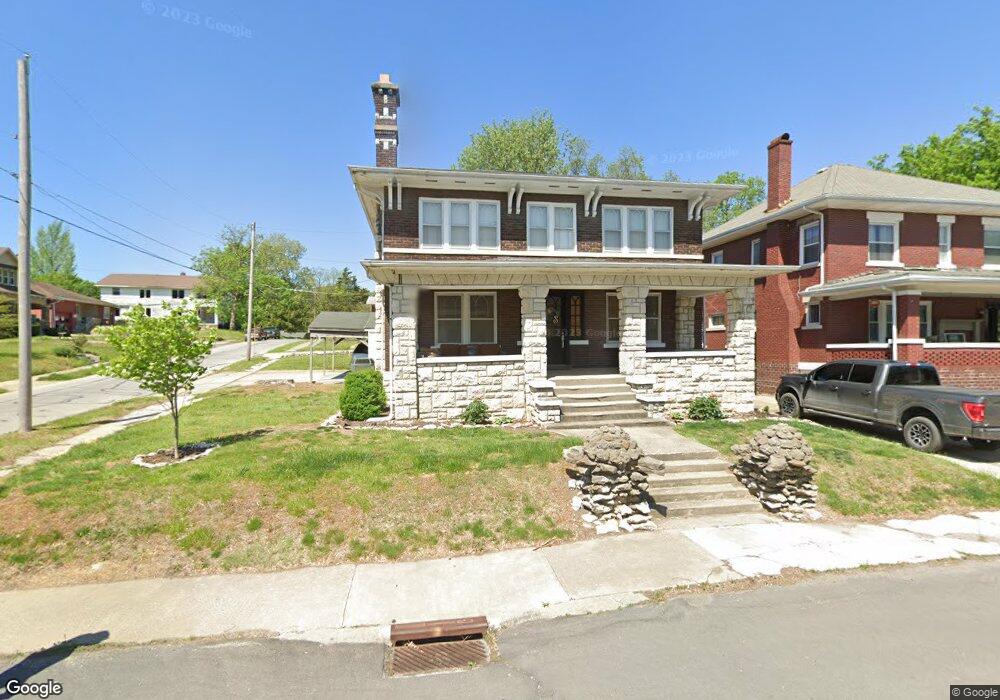
325 Epperson St Moberly, MO 65270
Estimated Value: $142,000 - $161,036
3
Beds
3
Baths
2,184
Sq Ft
$69/Sq Ft
Est. Value
About This Home
This home is located at 325 Epperson St, Moberly, MO 65270 and is currently estimated at $151,759, approximately $69 per square foot. 325 Epperson St is a home located in Randolph County with nearby schools including Moberly Senior High School, St. Pius X. Catholic School, and Maranatha Seventh-day Adventist School.
Ownership History
Date
Name
Owned For
Owner Type
Purchase Details
Closed on
Mar 1, 2007
Sold by
Wells Fargo Bank Na
Bought by
Seymour Kyle R and Seymour Catrina A
Current Estimated Value
Home Financials for this Owner
Home Financials are based on the most recent Mortgage that was taken out on this home.
Original Mortgage
$58,500
Outstanding Balance
$35,525
Interest Rate
6.32%
Estimated Equity
$116,234
Purchase Details
Closed on
Oct 24, 2006
Sold by
Kozeny & Mccubbin Lc
Bought by
Wells Fargo Bank Na
Create a Home Valuation Report for This Property
The Home Valuation Report is an in-depth analysis detailing your home's value as well as a comparison with similar homes in the area
Home Values in the Area
Average Home Value in this Area
Purchase History
| Date | Buyer | Sale Price | Title Company |
|---|---|---|---|
| Seymour Kyle R | $58,500 | -- | |
| Wells Fargo Bank Na | $63,750 | -- |
Source: Public Records
Mortgage History
| Date | Status | Borrower | Loan Amount |
|---|---|---|---|
| Open | Seymour Kyle R | $58,500 |
Source: Public Records
Tax History
| Year | Tax Paid | Tax Assessment Tax Assessment Total Assessment is a certain percentage of the fair market value that is determined by local assessors to be the total taxable value of land and additions on the property. | Land | Improvement |
|---|---|---|---|---|
| 2025 | $931 | $13,730 | $1,419 | $12,311 |
| 2024 | $9 | $12,790 | $1,235 | $11,555 |
| 2023 | $946 | $12,790 | $1,235 | $11,555 |
| 2022 | $881 | $12,240 | $1,235 | $11,005 |
| 2020 | $881 | $12,240 | $1,235 | $11,005 |
| 2019 | $879 | $12,240 | $1,235 | $11,005 |
| 2018 | $822 | $11,480 | $1,235 | $10,245 |
| 2017 | $820 | $11,480 | $0 | $0 |
| 2016 | $861 | $12,120 | $0 | $0 |
| 2014 | -- | $11,120 | $0 | $0 |
| 2013 | -- | $11,120 | $0 | $0 |
| 2012 | -- | $10,950 | $0 | $0 |
Source: Public Records
Map
Nearby Homes
Your Personal Tour Guide
Ask me questions while you tour the home.