Estimated Value: $144,276 - $184,000
--
Bed
1
Bath
1,138
Sq Ft
$140/Sq Ft
Est. Value
About This Home
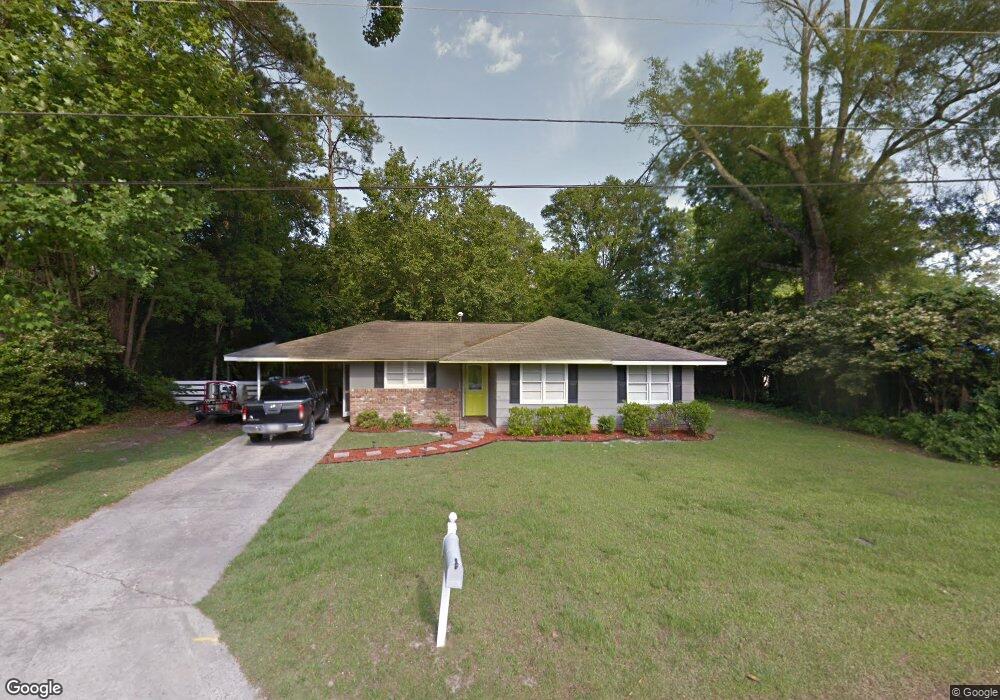
This home is located at 325 Evergreen St, Jesup, GA 31546 and is currently estimated at $159,069, approximately $139 per square foot. 325 Evergreen St is a home located in Wayne County with nearby schools including Jesup Elementary School, Arthur Williams Middle School, and Wayne County High School.
Ownership History
Date
Name
Owned For
Owner Type
Purchase Details
Closed on
Jan 29, 2011
Sold by
Pruitt Brian C
Bought by
Meredith Brandy D
Current Estimated Value
Home Financials for this Owner
Home Financials are based on the most recent Mortgage that was taken out on this home.
Original Mortgage
$78,982
Outstanding Balance
$53,969
Interest Rate
4.75%
Mortgage Type
FHA
Estimated Equity
$105,101
Purchase Details
Closed on
Aug 27, 2008
Sold by
Moseley Brent A
Bought by
Pruitt Brian C
Home Financials for this Owner
Home Financials are based on the most recent Mortgage that was taken out on this home.
Original Mortgage
$78,061
Interest Rate
6.48%
Mortgage Type
New Conventional
Purchase Details
Closed on
Oct 1, 2004
Bought by
Moseley Brent A
Purchase Details
Closed on
Aug 1, 2004
Purchase Details
Closed on
Sep 1, 1996
Purchase Details
Closed on
May 1, 1978
Purchase Details
Closed on
Jul 1, 1973
Purchase Details
Closed on
Apr 1, 1973
Create a Home Valuation Report for This Property
The Home Valuation Report is an in-depth analysis detailing your home's value as well as a comparison with similar homes in the area
Home Values in the Area
Average Home Value in this Area
Purchase History
| Date | Buyer | Sale Price | Title Company |
|---|---|---|---|
| Meredith Brandy D | -- | -- | |
| Pruitt Brian C | $76,500 | -- | |
| Moseley Brent A | $64,400 | -- | |
| -- | $35,000 | -- | |
| -- | -- | -- | |
| -- | -- | -- | |
| -- | -- | -- | |
| -- | -- | -- |
Source: Public Records
Mortgage History
| Date | Status | Borrower | Loan Amount |
|---|---|---|---|
| Open | Meredith Brandy D | $78,982 | |
| Previous Owner | Pruitt Brian C | $78,061 |
Source: Public Records
Tax History Compared to Growth
Tax History
| Year | Tax Paid | Tax Assessment Tax Assessment Total Assessment is a certain percentage of the fair market value that is determined by local assessors to be the total taxable value of land and additions on the property. | Land | Improvement |
|---|---|---|---|---|
| 2024 | $1,445 | $47,261 | $3,648 | $43,613 |
| 2023 | $1,050 | $29,684 | $3,560 | $26,124 |
| 2022 | $935 | $29,684 | $3,560 | $26,124 |
| 2021 | $1,001 | $29,684 | $3,560 | $26,124 |
| 2020 | $1,036 | $29,684 | $3,560 | $26,124 |
| 2019 | $1,066 | $29,684 | $3,560 | $26,124 |
| 2018 | $1,066 | $29,684 | $3,560 | $26,124 |
| 2017 | $918 | $29,684 | $3,560 | $26,124 |
| 2016 | $888 | $29,684 | $3,560 | $26,124 |
| 2014 | $891 | $29,684 | $3,560 | $26,124 |
| 2013 | -- | $29,684 | $3,560 | $26,124 |
Source: Public Records
Map
Nearby Homes
- 307 Cedar St
- 555 E Magnolia St
- 774 E Plum St
- 00 U S 301
- 705 S Elm St
- 661 E Plum St
- 945 S Palm St
- 412 E Orange St
- 241 S Elm Ln
- 111 N Mahogany St
- 1312 E Plum St
- 658 E Walnut St
- 655 Littlefield St
- 985 Seven Oaks Rd
- 301 U S 301
- 805 Littlefield St
- 775 Catherine St
- 1101 S Palm St
- 0 E Oak St
- 385 N Hickory St
- 375 Evergreen St
- 285 Evergreen St
- 310 Evergreen St
- 598 S Palm St
- 189 Cedar St
- 305 Cedar St Unit 20
- 307 Cedar St
- 307 Cedar St Unit 21
- 562 S Palm St
- 303 Cedar St Unit 19
- 203 Evergreen St
- 542 S Palm St
- 212 Cedar St
- 218 Cedar St
- 536 S Palm St
- 273 Oak Villa Dr
- 212 Evergreen St
- 291 Oak Villa Dr
- 590 S Palm St
- 192 Cedar St